Sensing & control
Acoustic thermometry and drift correction, connected to fault-aware controls and traceable operating records.
Read the sensing program ZEMANIUM
Work with us
Our mission is to make geothermal the world’s dominant energy source. We develop equipment around the costs that stand in its way: lost measurements, restricted flow, damaged wells and expensive power conversion.
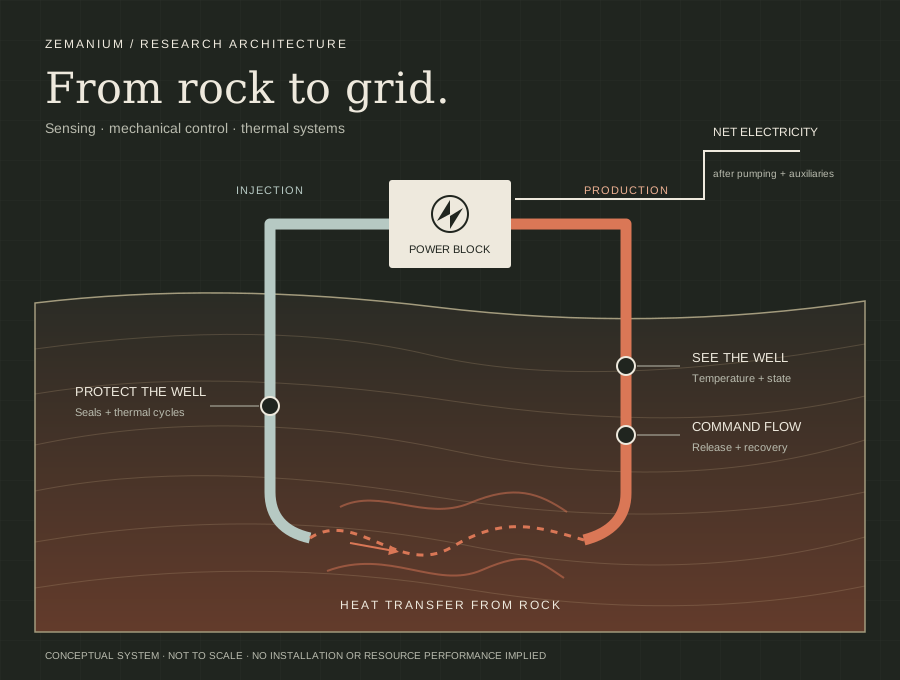
We adapt useful engineering from other industries and develop it for geothermal duty. Each design must justify its installation cost, operating burden and effect on lifetime electricity output.
Acoustic thermometry and drift correction, connected to fault-aware controls and traceable operating records.
Read the sensing programCommanded release and fouling recovery. Experiments measure thermal contact and net heat recovery as well as mechanical travel and deposit removal.
Read the release programMoving pressure boundaries and whole-assembly thermal-cycle tests. The seal, connection, casing and cement are evaluated together.
Read the integrity programDrilling-temperature control, matched-bit cost comparison and power-block models. Plant and well costs share one capital budget.
Read the conversion programBuild sets, cutaways and test fixtures for the current development revisions. These drawings do not show installed equipment.
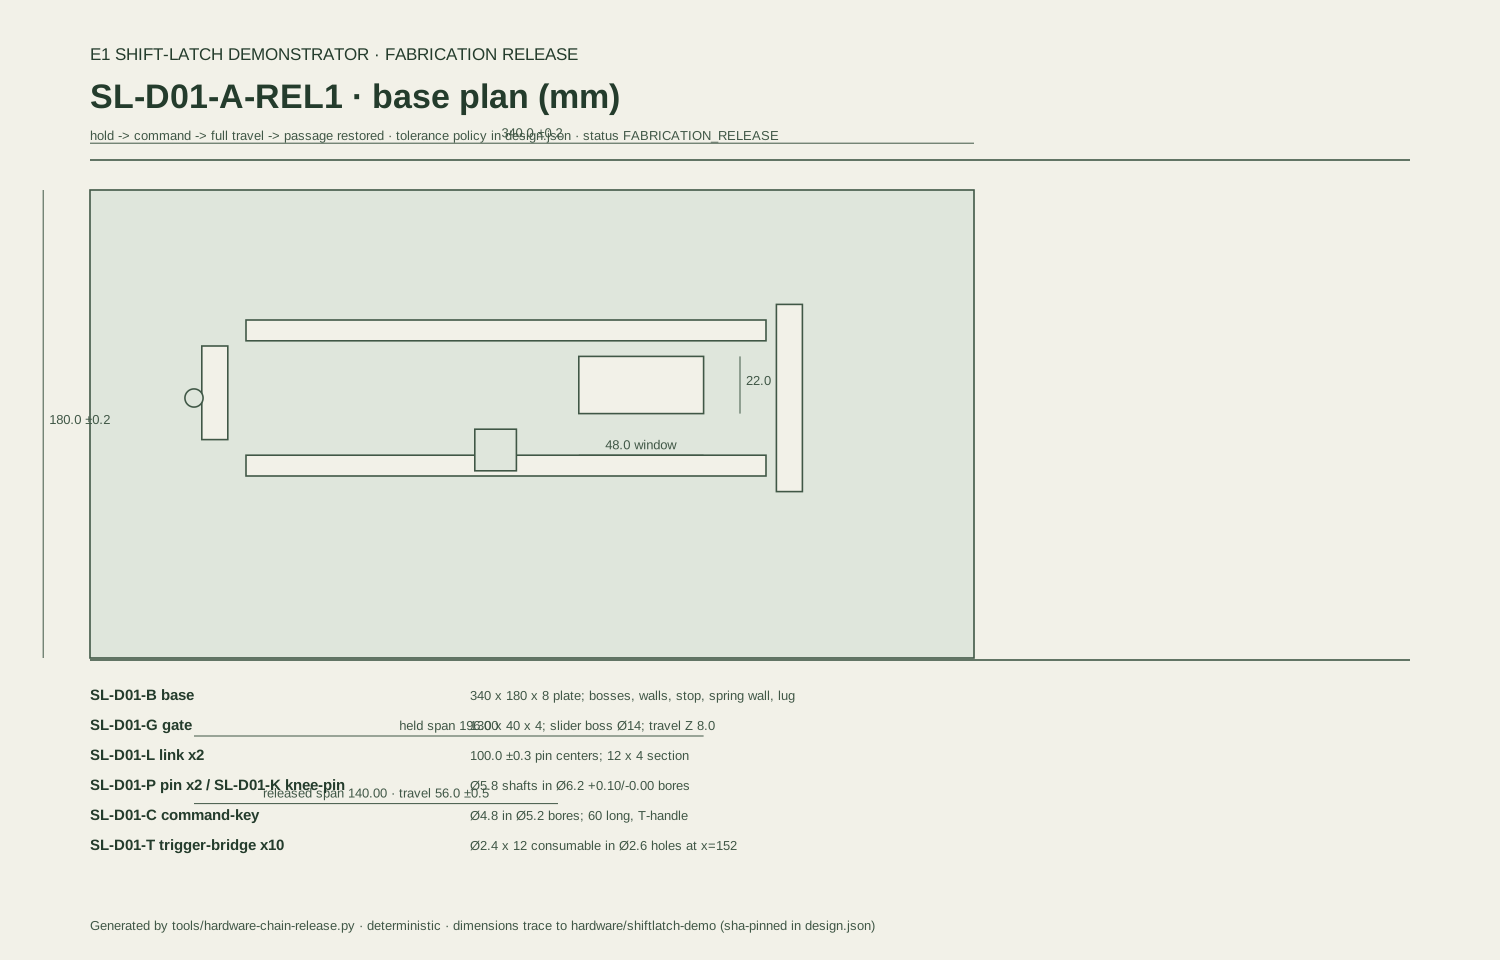
Room-temperature fabrication package for testing hold, commanded release, full travel and conductance recovery. The hot-duty model is registered separately.
SL-D01-A-REL1 · room demonstrator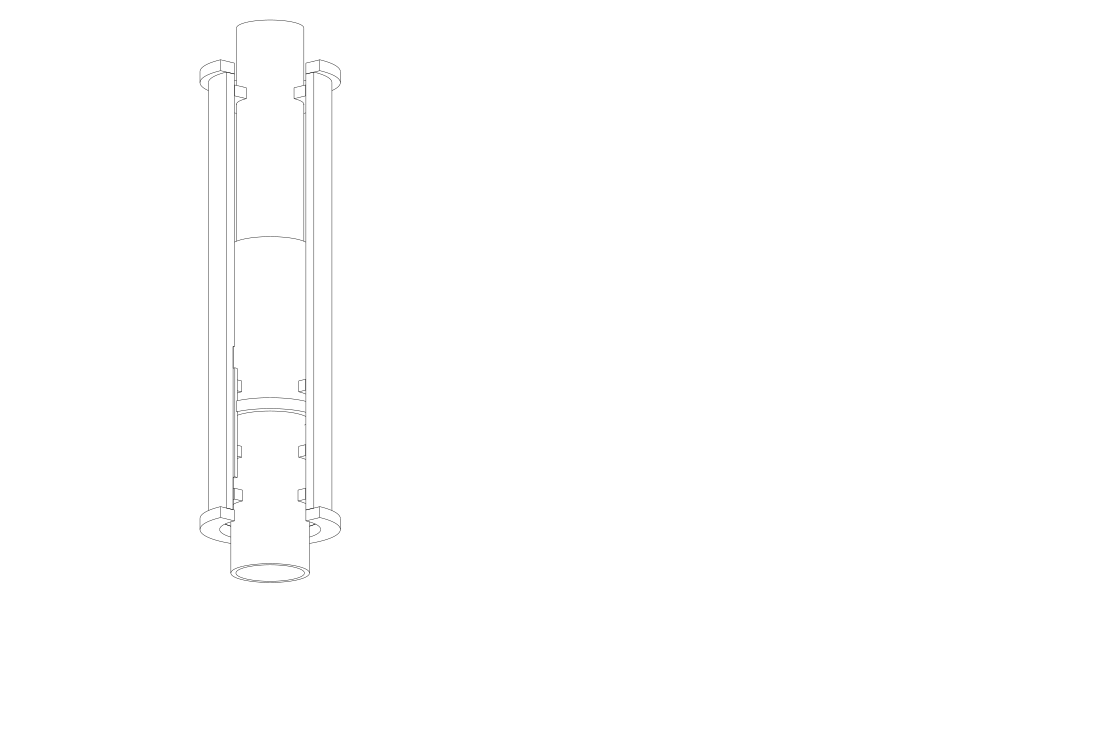
Short-cycle seal models and a computational bench design. Current FS-B01-B pressure operation awaits facility engineering release.
Public cassette envelope · engineering review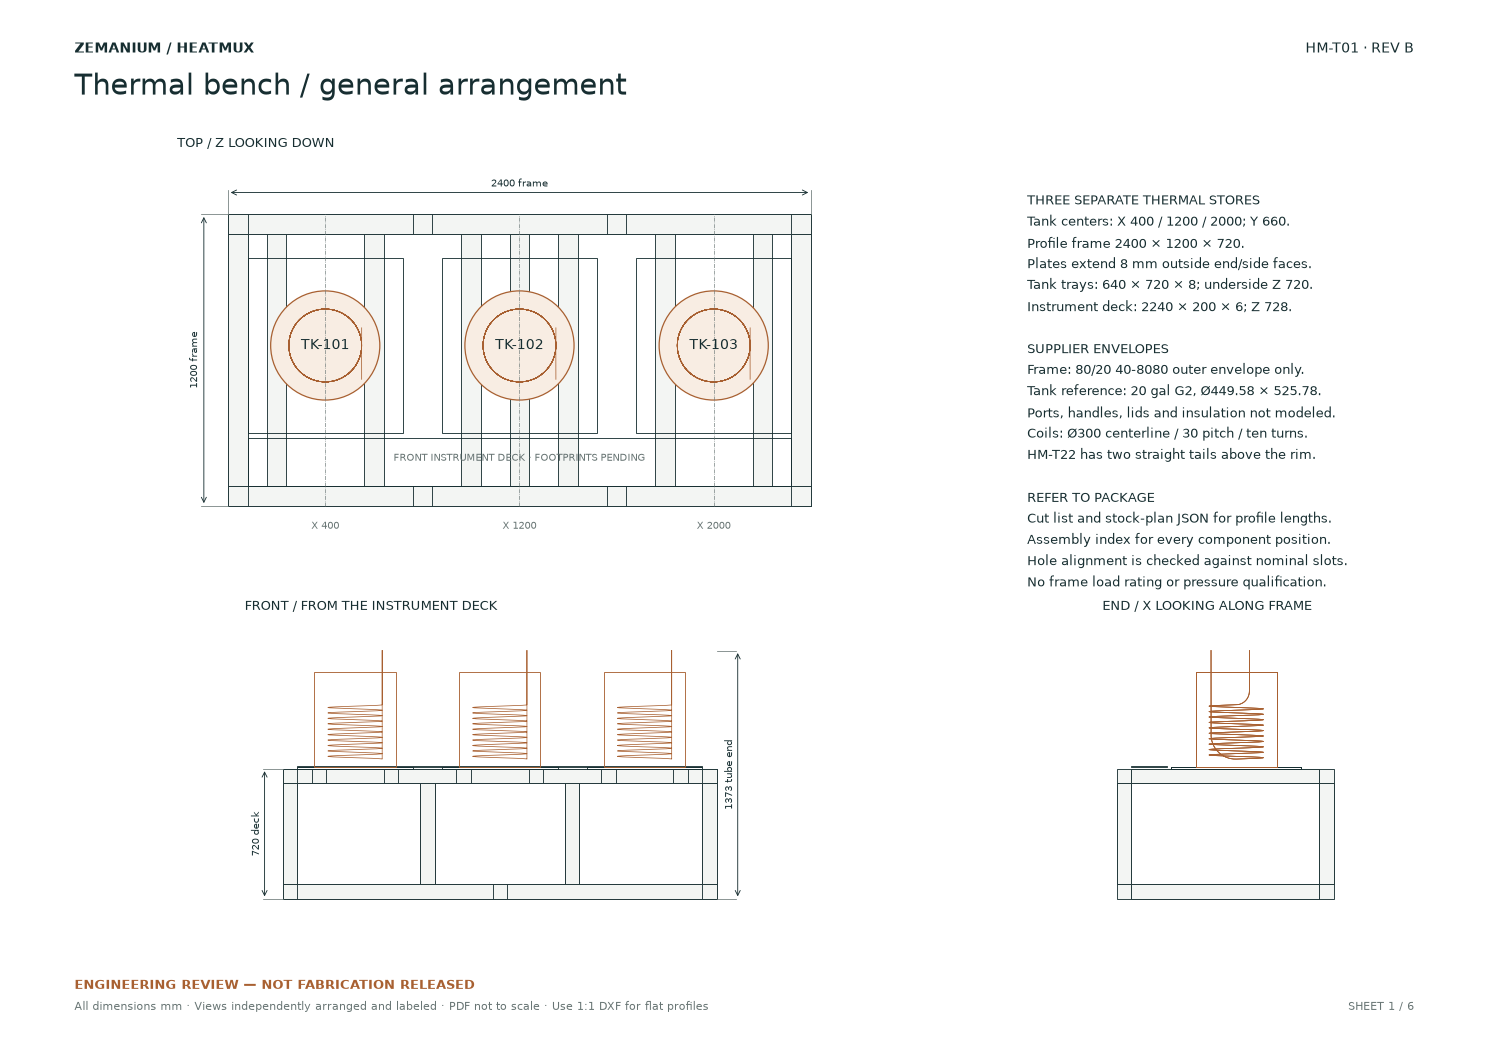
Engineering-review layout for the heat source, thermal stores, flow routing and measurement chain.
Development drawing · thermal verificationSL-D01-A · Room-temperature demonstrator
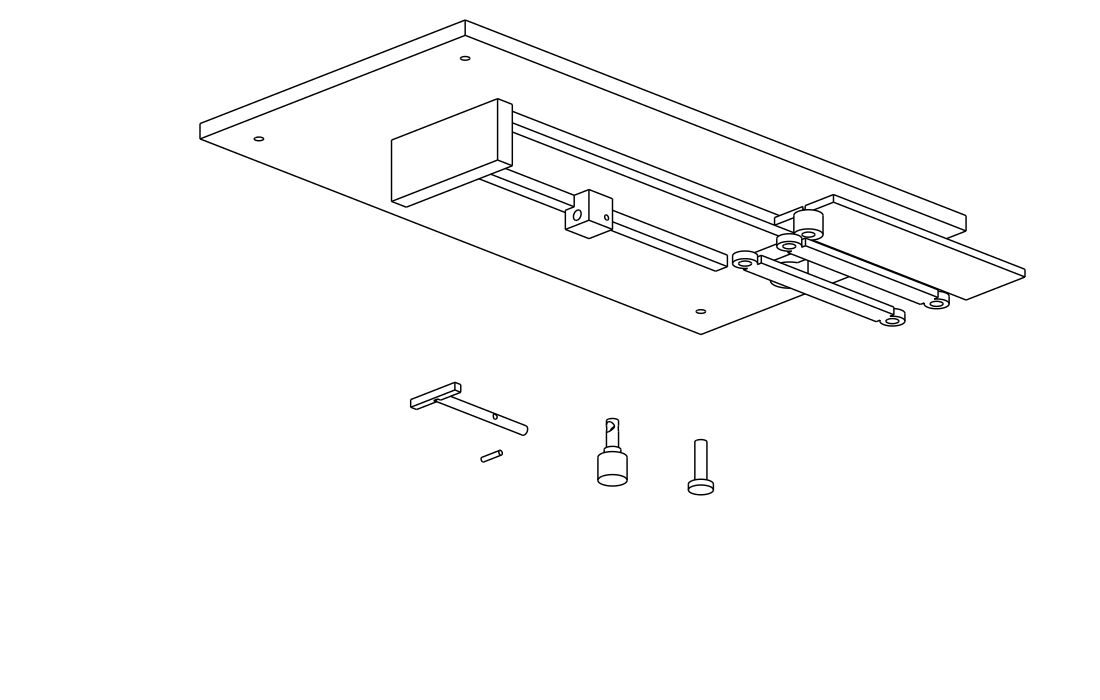
The folding brace changes the gate position by 56 mm in the checked geometry. These are two CAD states, not footage of manufactured hardware or a hot-pressure test.
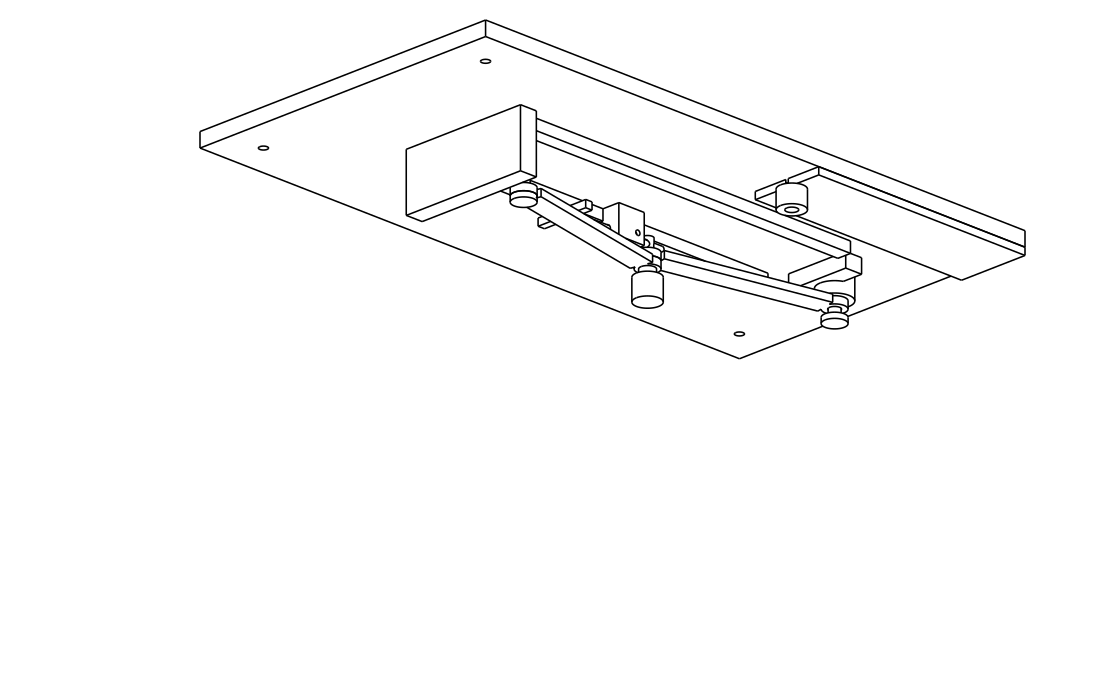
The command key restrains the brace; the gate covers the passage.
Download held drawing · SVG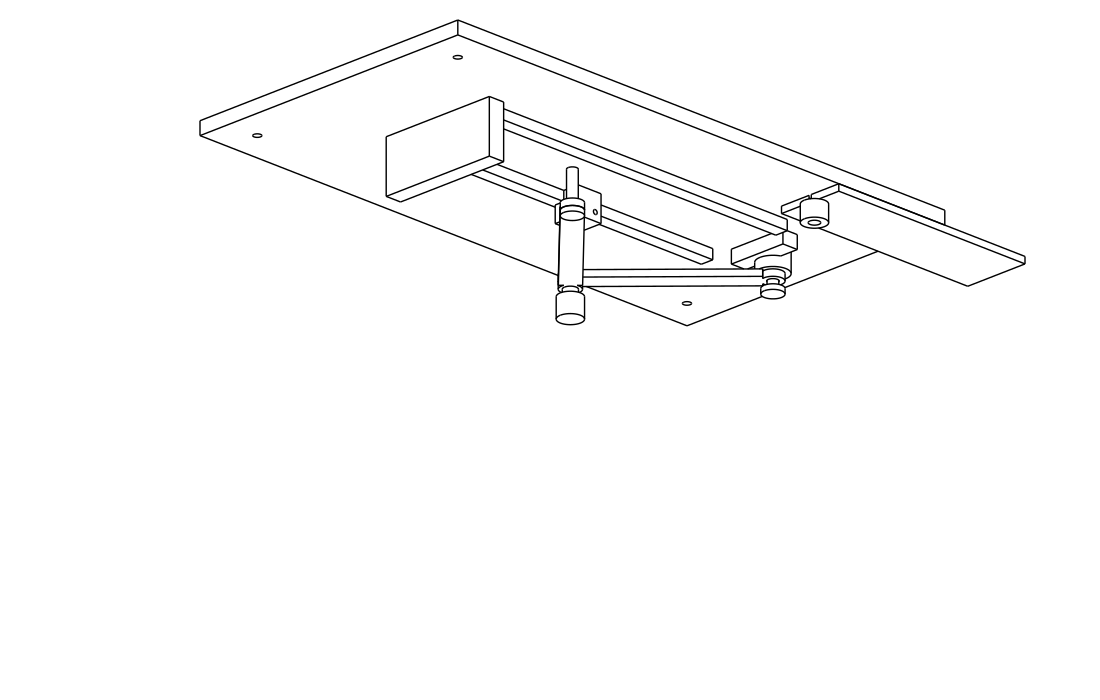
The brace folds and the gate reaches its travel stop, clearing the passage.
Download released drawing · SVGE7 · Whole-assembly experiment
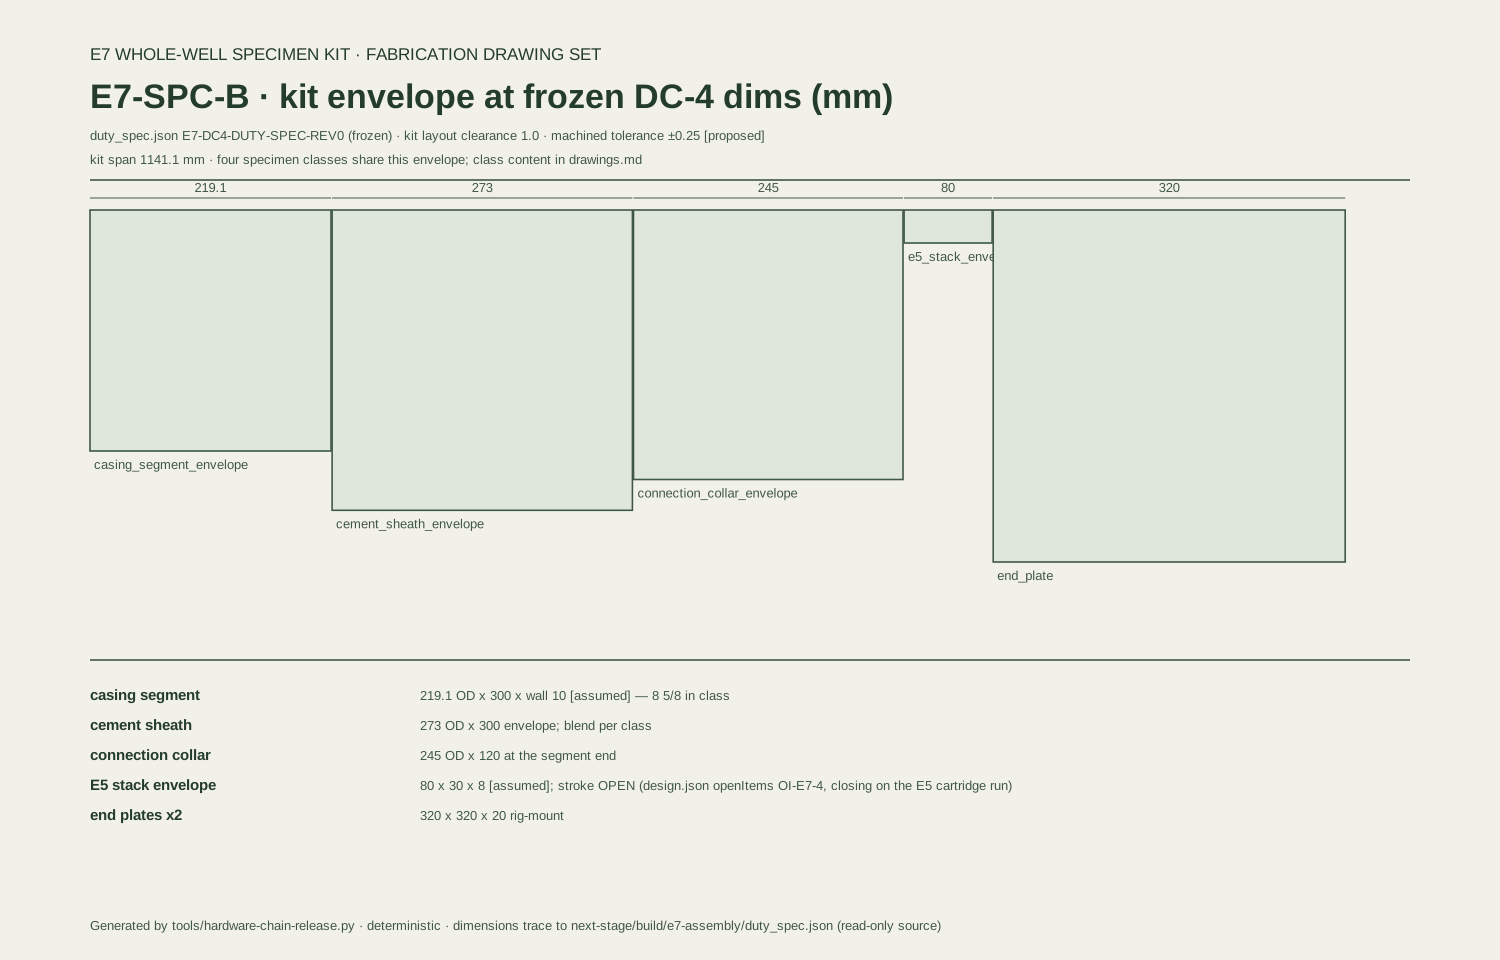
The planned campaign tests the casing, cement, connection and compliance envelopes as an assembly. The retained E7-SPC-A illustrations show concept envelope boxes; the E7-SPC-B build sheet is the later fabrication drawing set. Neither establishes pressure authorization or completed exposure.
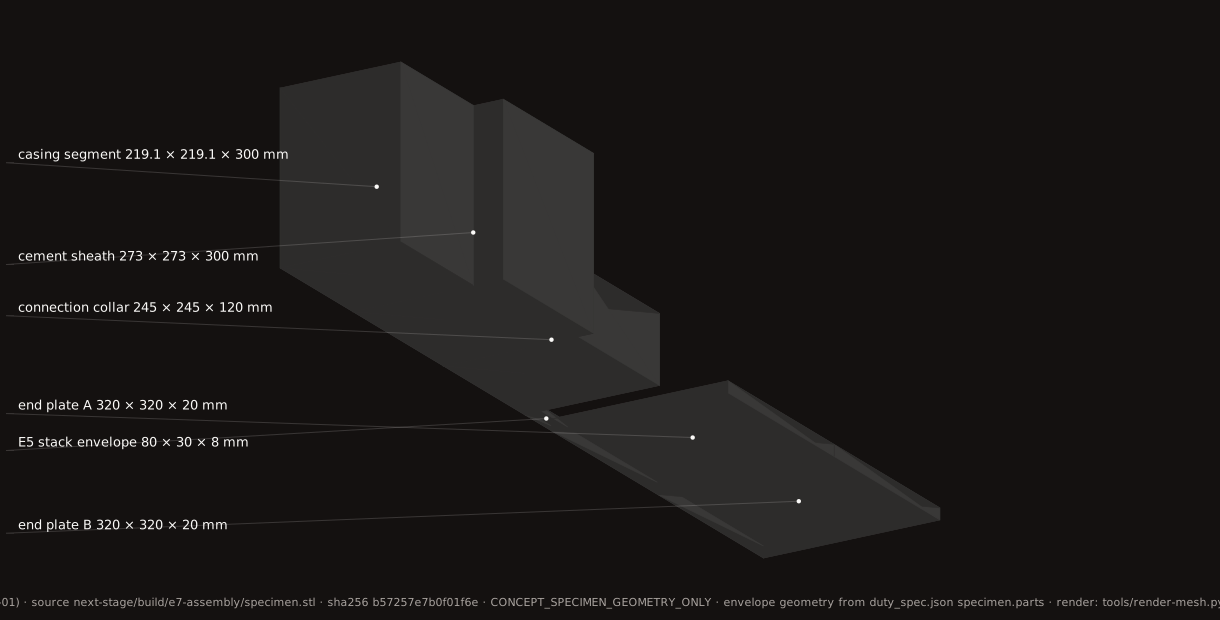
E7-SPC-A · concept geometry retained from the 3 October presentation.
Download envelope drawing · SVG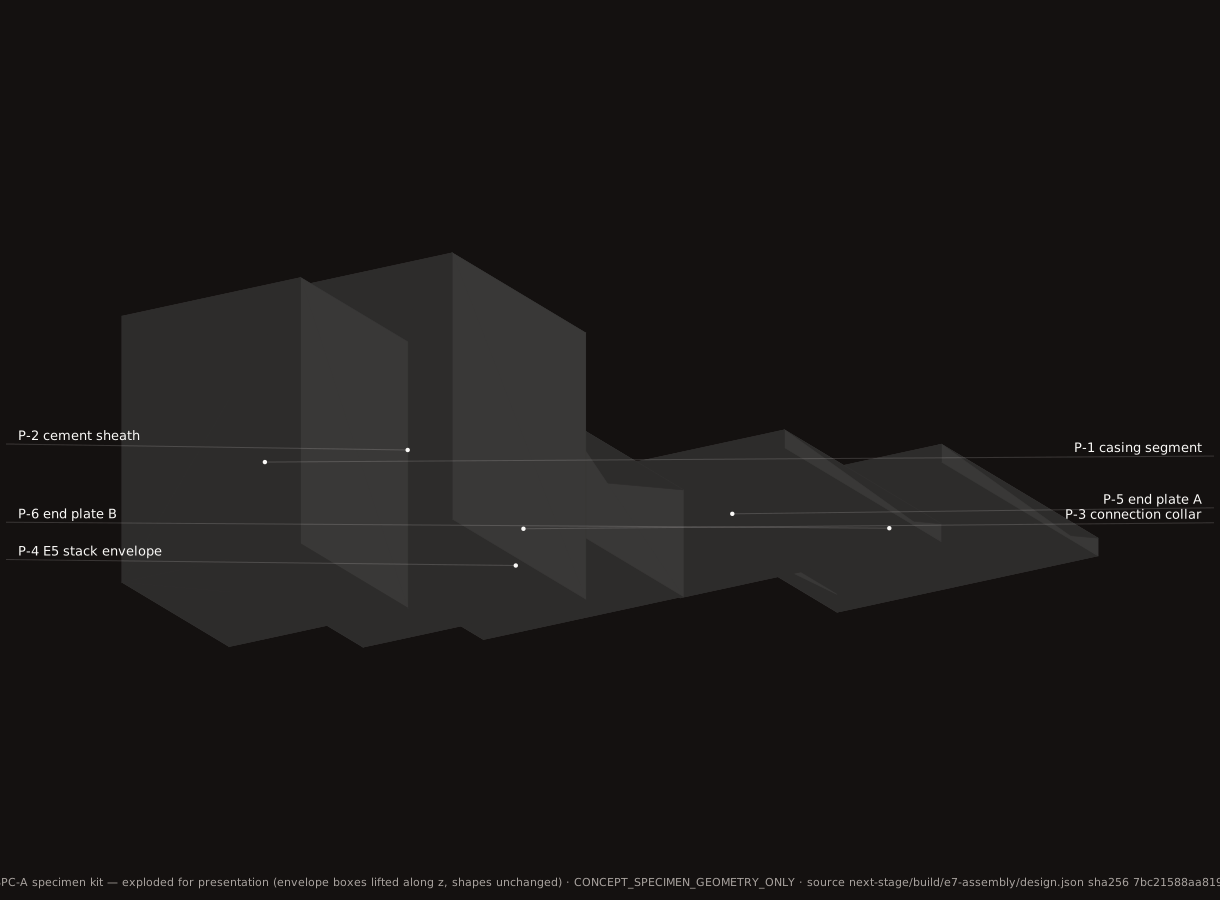
The same concept envelopes, separated for inspection. Not a detailed seal mechanism.
Download exploded envelope · SVGFlow & chemistry · Development fixtures
Dry-fit geometry for controlled observations. These fixtures have no pressure rating and do not demonstrate treatment performance.
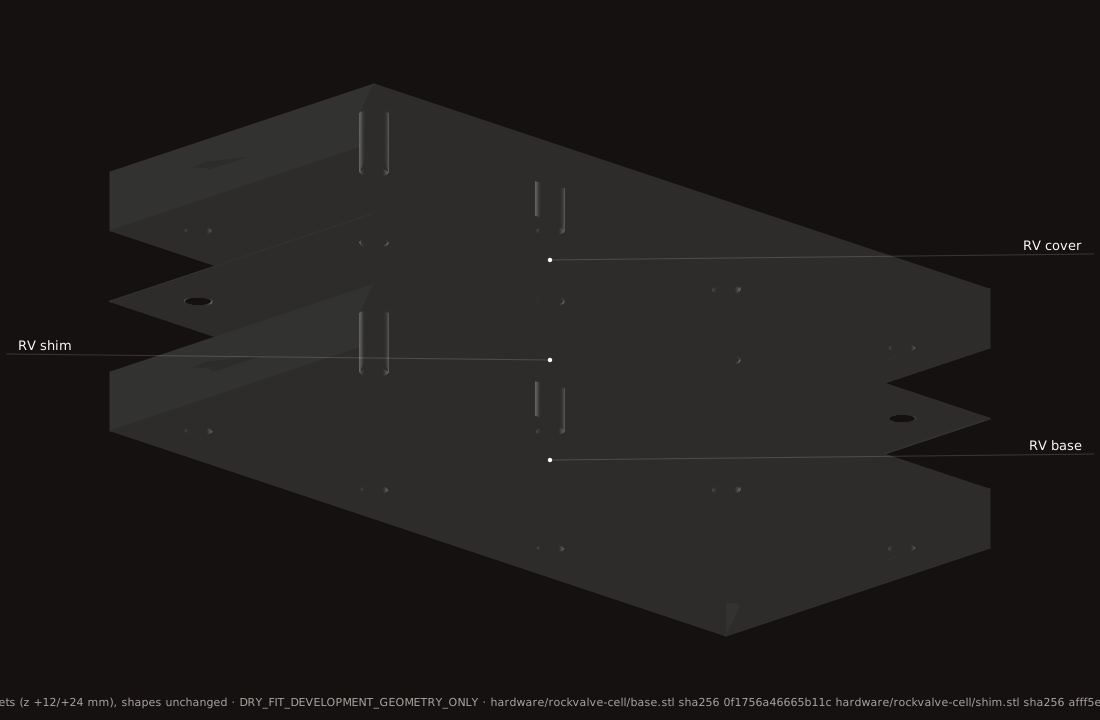
Public three-part dry-fit cell. Exploded presentation offsets do not change the part geometry.
Download cell drawing · SVG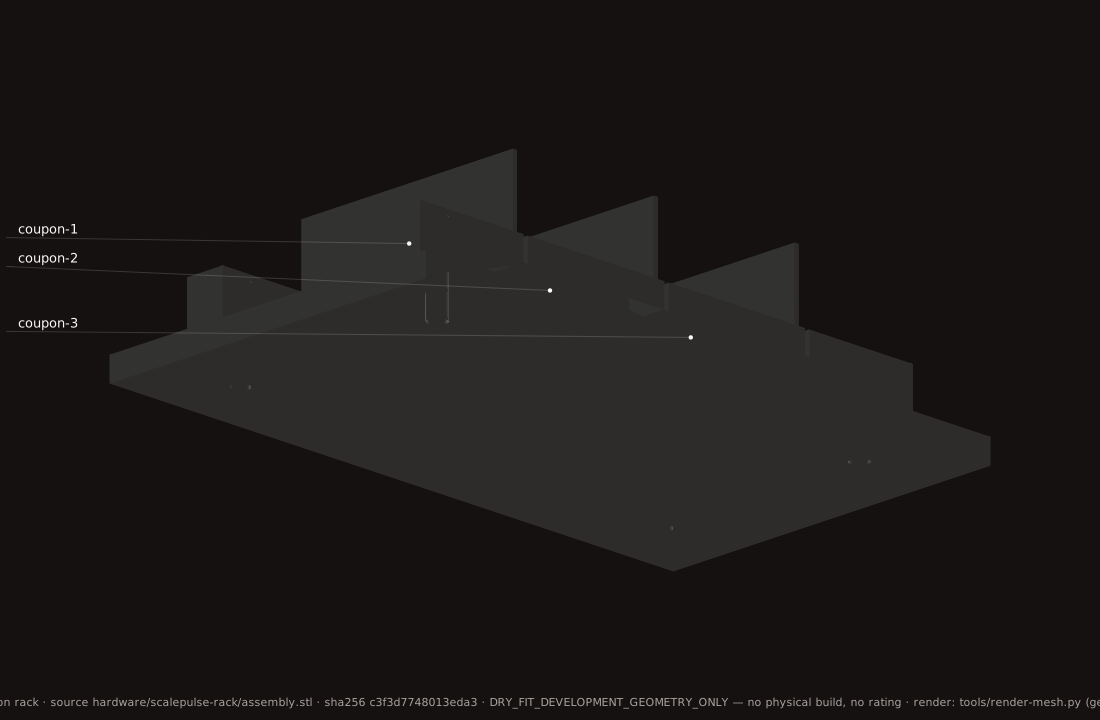
SP-R01 · dry-fit development geometry for deposit-rate observations, not a cleaning device.
Download rack drawing · SVGFind the current revisions, registered duties and planned experiments in the dossier.
Open the technical dossierHigh-temperature sensing · 8 October 2026
Our updated readout reduces maximum midpoint temperature error from 131.178 K to 1.240 K on the same simulated phase-change case. All 80 comparison points pass the temperature criterion; the maximum interval/reference comparison bound is 4.343 K against a 5 K limit.
SIMULATED: 25–500 °C heating and cooling, four pulses over four modeled seconds per point. This is a waveform challenge, not an endurance run or measured instrument accuracy.
The remaining gate is visible. Only 113 of 128 paired trials meet the separate 1 ns phase-transfer limit; the maximum is 1.382 ns. The full readiness campaign does not pass.
Results and physical test plan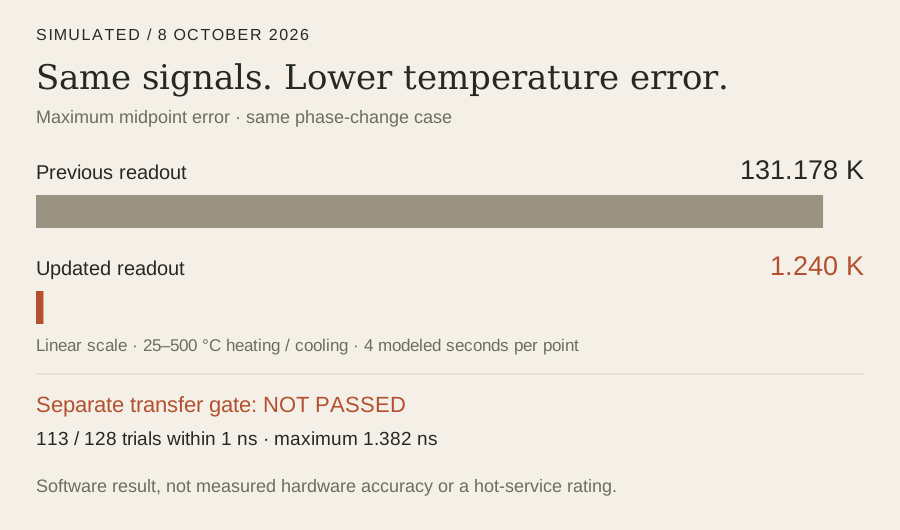
Separate endurance model. The earlier nominal digital-furnace model reduces maximum error from 9.63 °C to 2.23 °C over 500 simulated hours at a nominal 450 °C gauge-segment temperature. It is a different experiment, not directly comparable to the waveform challenge above.
19 November 2026: long-line gate failed, sensor stopped. SIMULATED We asked whether this kind of sensor, read from the surface, could measure temperature and strain along 3,000 m of well. The pass rule was fixed and time-stamped before the run: 2.5 K and 75 microstrain at the 95th percentile. None of 400 combinations of geometry, scheme, frequency and gauge length came within 5 K. The signal reached the surface in at most 90.2% of trials, and where it did the best option read 9.4 K. We stopped the long-line sensor. The readout results above stand as dated software results, and the proposed 550 °C bench demonstration is withdrawn. Well work above 375 °C continues with commercially available gauges.
Physics models and uncertainty campaigns use frozen predictions and failure criteria. The bench then tests those predictions at the specified duty.
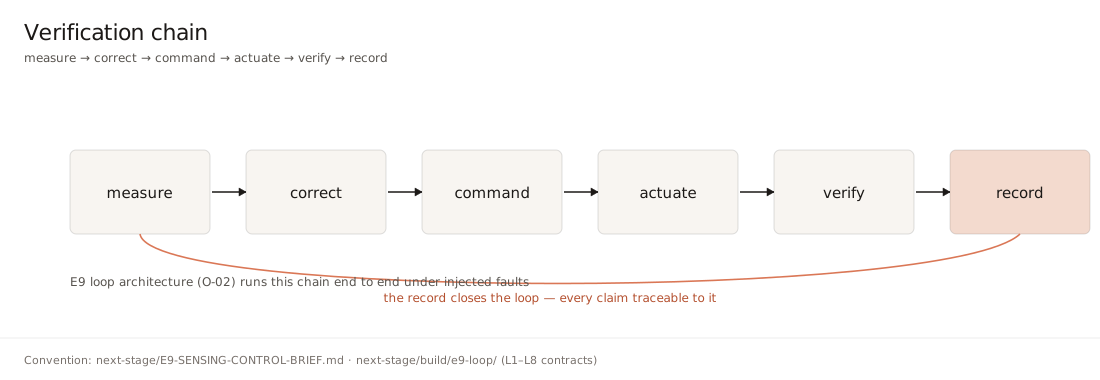
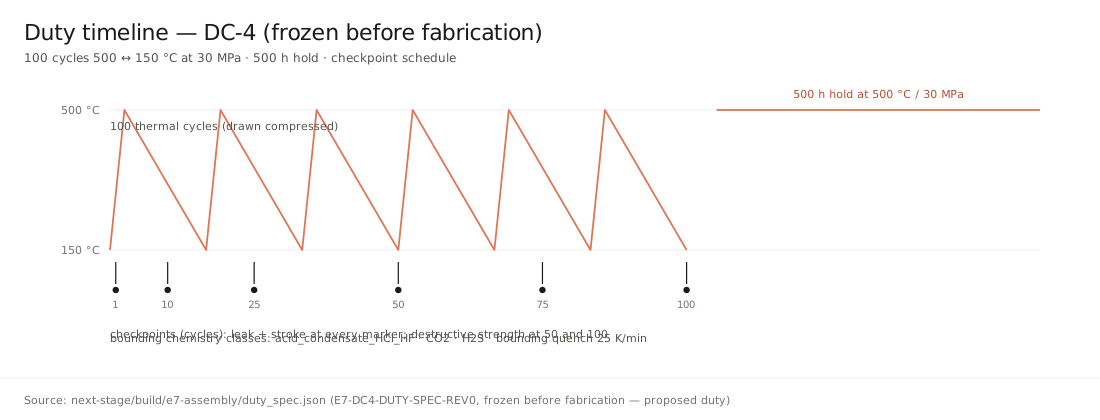
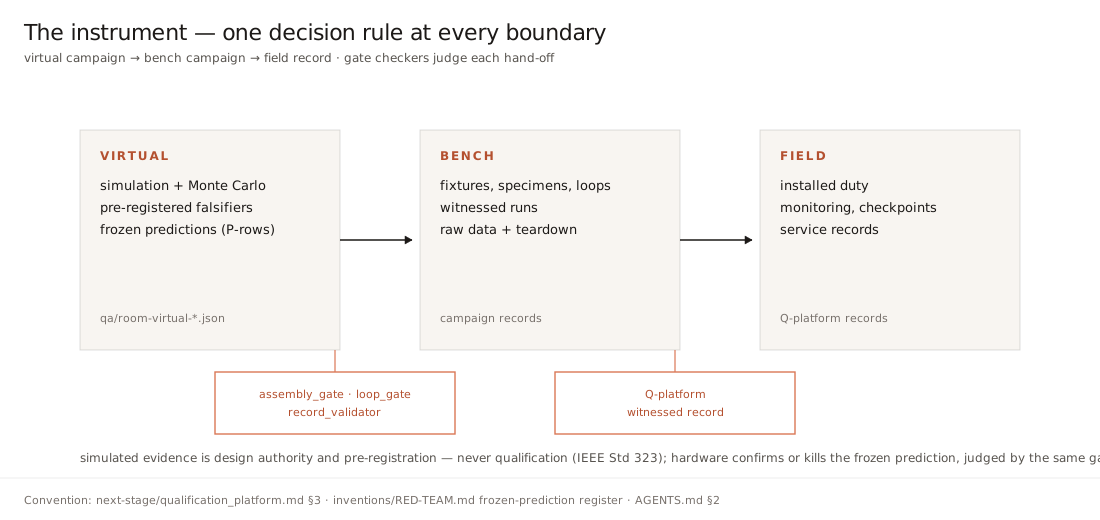
Predictive models, development geometry and measured records each have a distinct role.
Methods and evidence requirementsThe current model sets joint requirements for the plant, wells and financing. $30/MWh remains the long-term target; the $43.35 and $35.00 cases identify cost packages to engineer and quote.
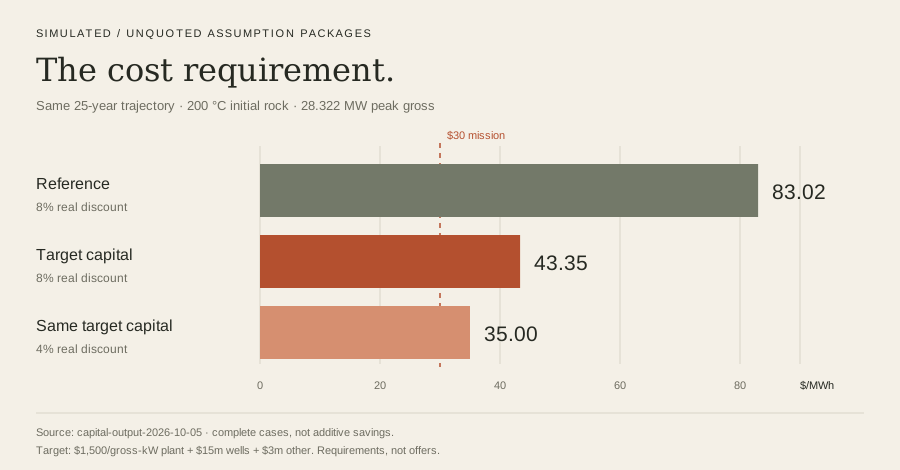
Change capital, flow, completion size and financing. Inspect the net-output ledger.
Run the live modelReservoir explorer · Illustrative 3D research model with historical design assumptions. Use the live model above for the current controlled economics.
Supporting research · 2–3 October 2026
Earlier models explain the design questions and failed assumptions. Each retains its original boundary; these are not the current power-cost cases or measured hardware results.
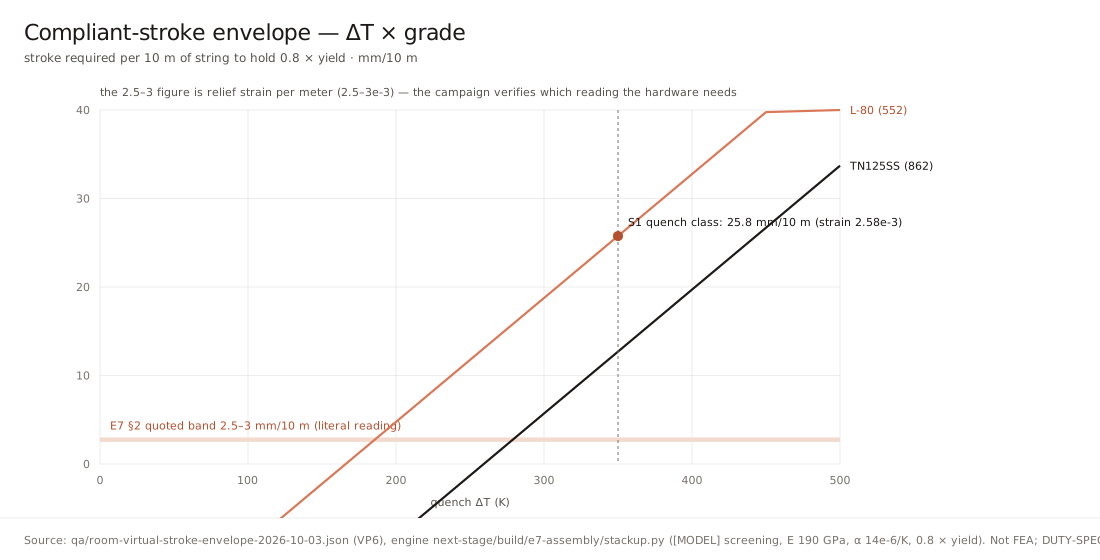
3 October · [MODEL] axial screening, not FEA. The L-80 example at a 350 K quench requires 25.8 mm per 10 m; the old 2.5–3 figure is a strain-versus-stroke interpretation issue, not measured seal travel.
Read source record · JSON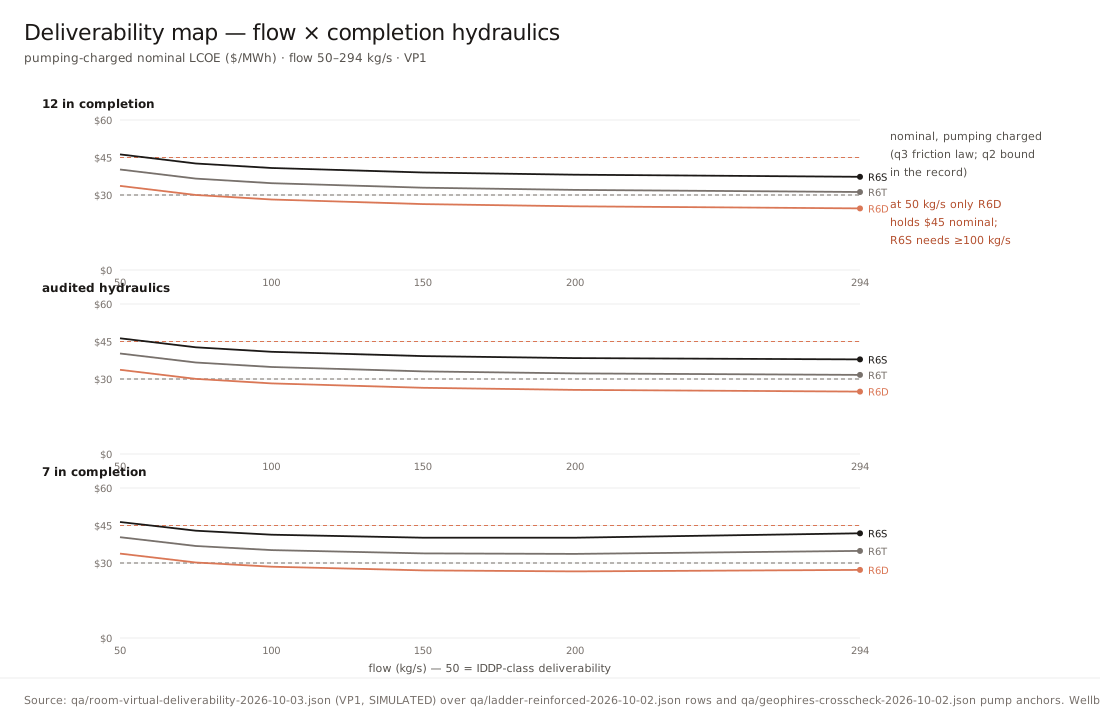
3 October · SIMULATED historical superhot cases. Flow and assumed pumping laws change net output and cost; hydraulics at the 500 °C spec resource were not measured. This is not the current 200 °C, 25-year economic case.
Read source record · JSON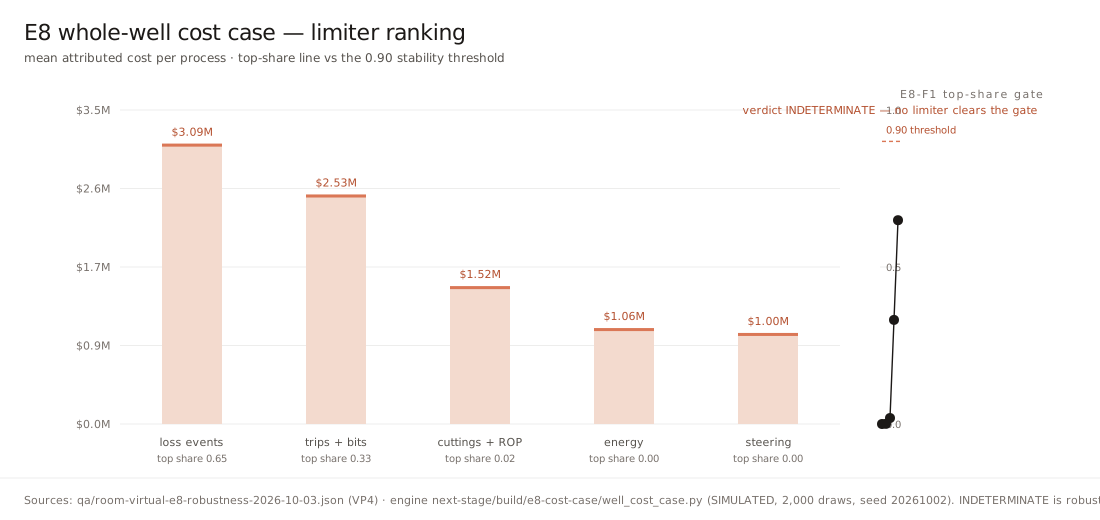
3 October · SIMULATED assumed 6,000 m spec well. All six range variants remain INDETERMINATE. Matched penetration-rate and bit-life measurements decide the intervention; this ranking is not delivered savings.
Read source record · JSON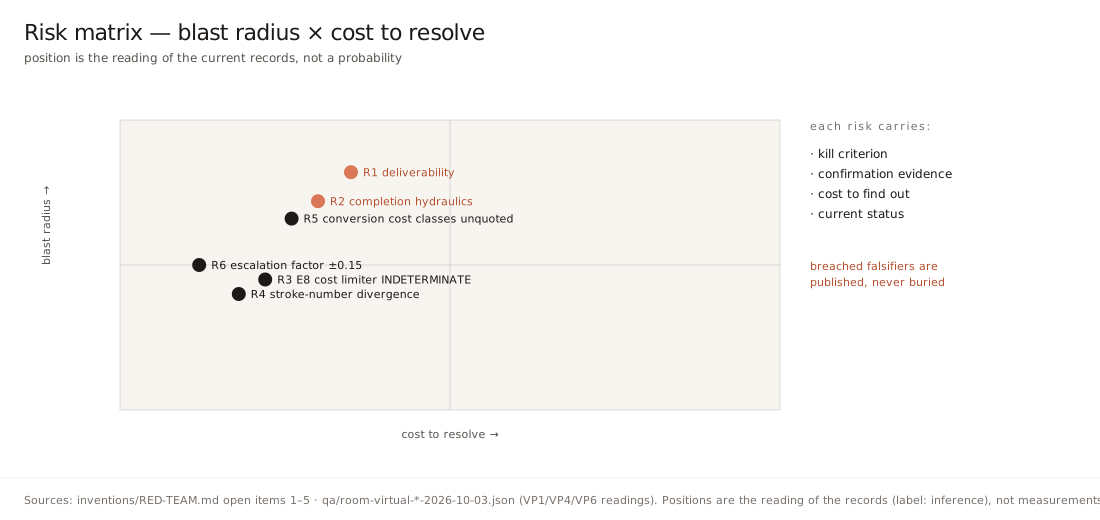
3 October · qualitative reading of the historical records. Positions represent inferred consequence and cost to investigate, not measured risk or probabilities. A breached falsifier identifies a redesign lever.
Download risk diagram · SVG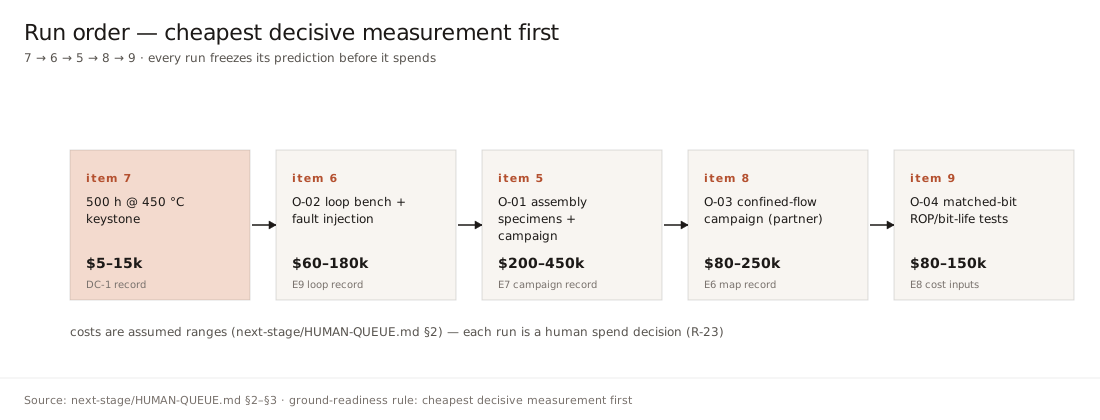
3 October presentation · proposed experiments and assumed spend ranges. No booked lab, vendor quote or committed funding is implied. The sensing keystone is a planned 500-hour run at 450 °C.
Download experiment diagram · SVG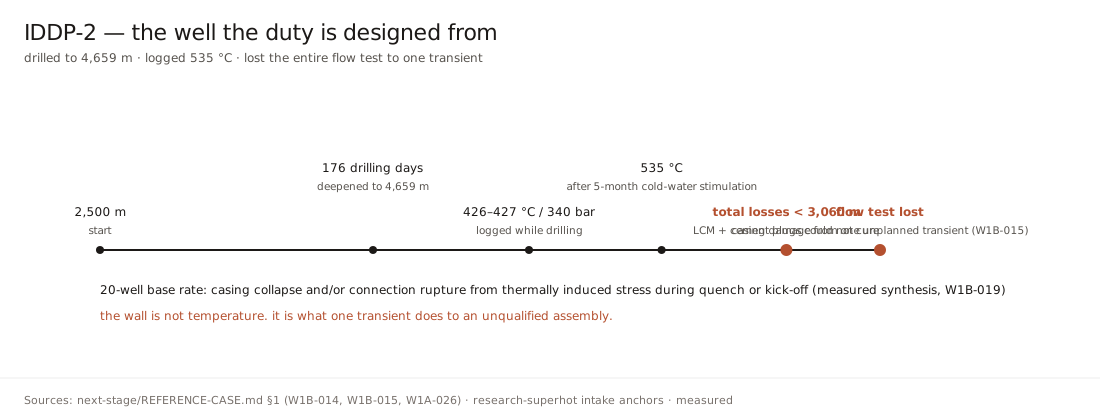
External published well history, not a Zemanium result. The 426–427 °C drilling log and 535 °C log after five months of stimulation are observations at different times, not sustained instrument ratings.
Historical claim and source trace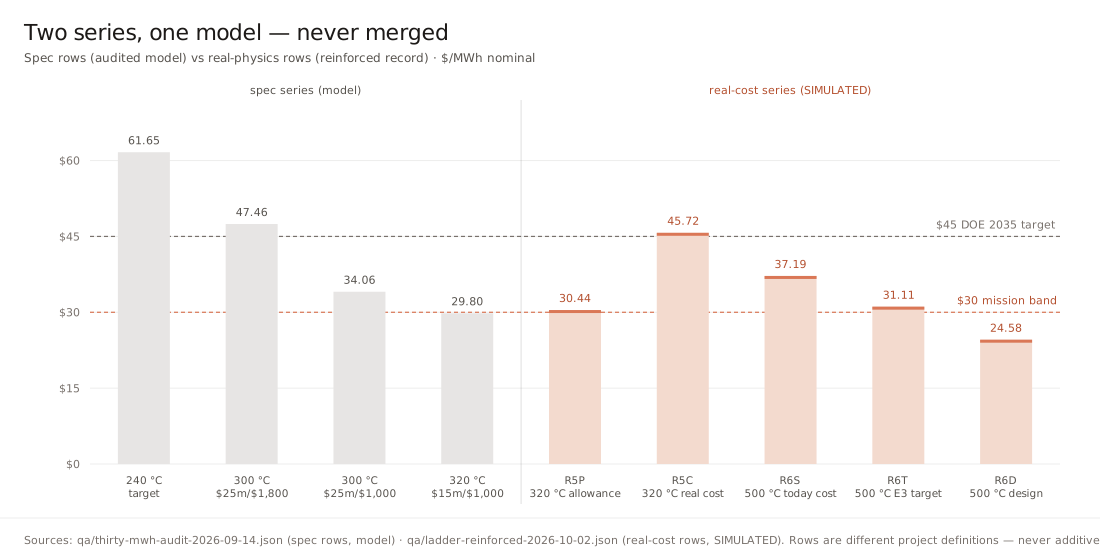
2 October · SIMULATED historical project definitions. Specification allowances and cost-class cases are separate series. Their prices and invention savings are neither additive nor transferable to the current model.
Read source record · JSON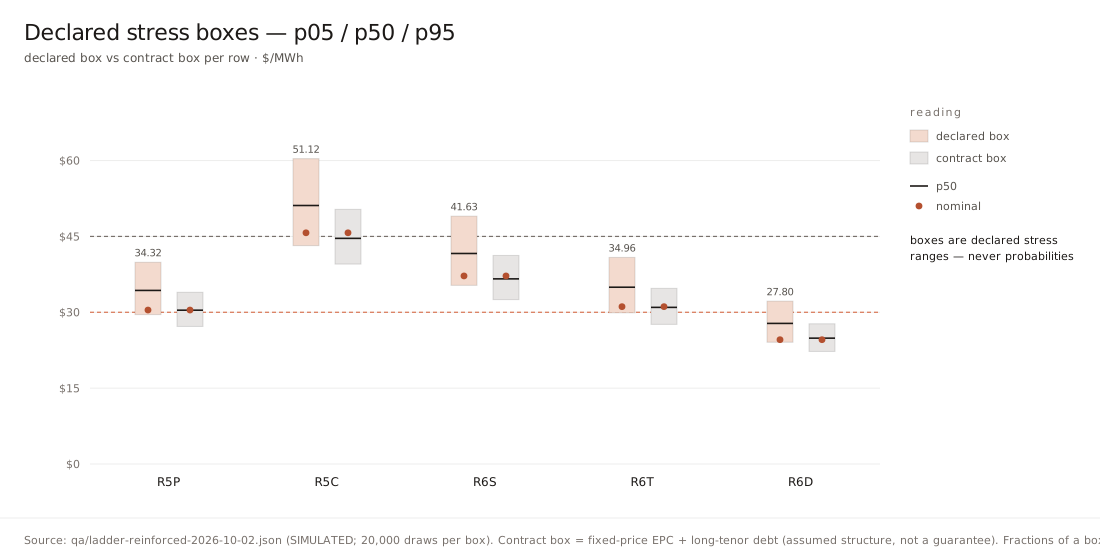
2 October · SIMULATED assumption ranges. Fractions of a declared box are not probabilities; fixed-price EPC and long-tenor debt are assumed structures, not agreements or guarantees.
Read source record · JSONThe current economic release uses a shared physical trajectory and peak-sized plant capital.
Use the current modelInspect or download the retained simulation inputs, assumptions, failures and source hashes. Hardware drawings are downloadable beside each illustration above.
Historical records · 2–3 October 2026 · SIMULATED. The E7, E9, Q and duty-corner records used earlier checkers; their positive verdicts do not establish conformance to the revised 5 October contracts. They cannot authenticate physical measurements or qualify hardware. The current dossier states the revised results.
Lead a physical experiment, sponsor a test campaign or discuss investment in our work on wells above 375 °C. We are building toward equipment deployments and, over time, our own geothermal plants.
For enquiries, email toni@zemanium.com.
Use the address in your email service, or compose in Gmail .
Research overview · updated 20 November 2026. Dated drawings and records retain their engineering identifiers. New mechanism details require filing clearance before disclosure. Partner participation is named only with consent.