
01 / The integrated program
System scope.
Geothermal becomes a compelling power source when a well delivers useful heat, the completion survives its operating history, and the power block converts that heat at a competitive installed cost. Improving any one component matters only if the complete system benefits.
Zemanium connects physics models, sensing, mechanical design and controls around that boundary. The research program spans high-temperature sensing (E0), commanded release (E1), deposit control (E2), power conversion (E3), drilling thermal control (E4), well integrity (E5), confined flow (E6), assembly durability (E7), drilling-cost attribution (E8), and integrated control (E9). The Q record layer connects the experiments to their evidence.
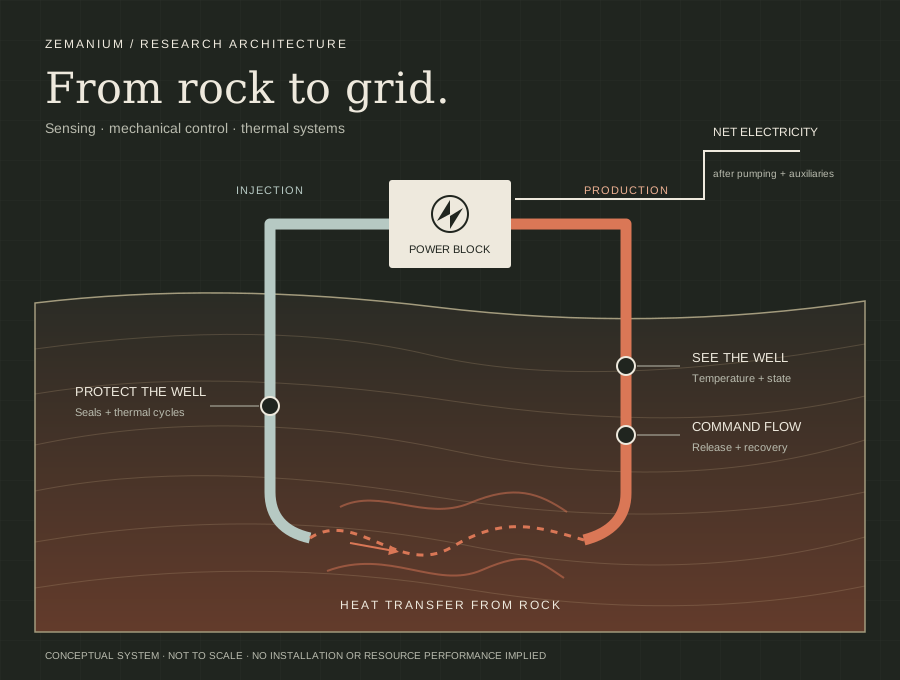
Our mission is to make geothermal the world's dominant energy source, with a $30–45/MWh development target. Current price scenarios specify requirements on the plant, wells and financing. They are not delivered project prices.
02 / E0 · High-temperature sensing
Measure temperature through changing conditions.
0 of 400 options within 5 K over 3,000 m
We tested whether this sensor could be read from the surface along a 3,000 m well. The pass rule, 2.5 K and 75 microstrain at the 95th percentile, was fixed and time-stamped before the run. No combination of geometry, scheme, frequency and gauge length came within 5 K; the signal reached the surface in at most 90.2% of trials. The long-line sensor is stopped and the 550 °C bench demonstration below is withdrawn. Sections dated October describe the readout software as it stood then. Well work above 375 °C continues with commercially available gauges.
A well's temperature history determines what its instruments and structure must survive. Our first build program investigates acoustic waveguide thermometry: a passive hot-zone sensing element connected to a cooler readout, with multiple temperature stations and correction for drift and fouling.
131.178 → 1.240 K maximum midpoint error
Previous and updated readouts evaluated on the same simulated phase-change signals. Basis: 25–500 °C heating/cooling, four pulses over four modeled seconds per point. All 80 points pass the temperature criterion; the maximum interval/reference comparison bound is 4.343 K against a 5 K limit. A 1 K temperature difference equals 1 °C.
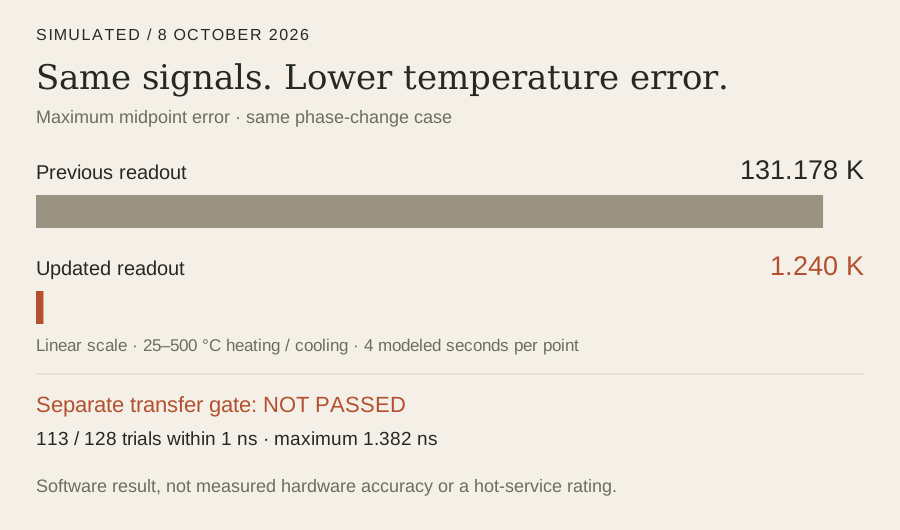
Full readiness campaign: not passed. 113 of 128 paired phase-transfer trials meet the 1 ns limit; 15 fail, with a maximum of 1.382 ns. A separate true-delay challenge retains 15.445 K maximum midpoint error and fails the temperature comparison. Improved waveform handling does not remove physical timing ambiguity. Trial counts are not probabilities of hardware success.
Development status. The readout is implemented and exercised on simulated signals. Physical calibration, matched-duty amplitude evidence and witnessed hot performance remain open. The proposed initial 550 °C / one-hour demonstration is unperformed and unbooked, subject to facility and engineering release; it would not replace endurance or customer acceptance.
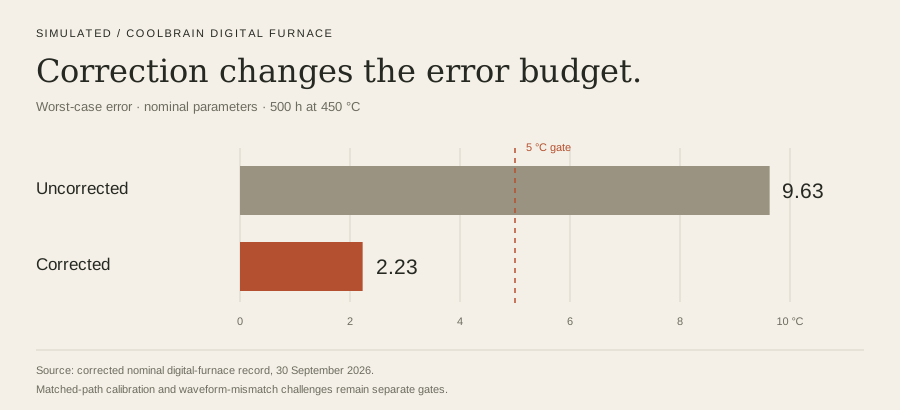
2.23 °C worst-case corrected error
Against 9.63 °C without correction over a 500-hour simulated run at 450 °C, nominal parameter set; ±5 °C accuracy gate. Source: corrected 30 September digital-furnace record.
Acquisition result. The blind fixed-trigger A-scan simulation resolves the expected echoes within the frozen ≤2 ns centered-repeatability and ≥10 dB isolation gates. Bias and error RMS remain separate from repeatability. Matched-duty amplitude calibration is still required.
The next measurement. Station-dependent waveform mismatch does not cancel in segment differences. Measure each station's impulse response and phase, then challenge the estimator with held-out waveforms before promoting temperature accuracy.
The physical ladder
- Room-temperature acquisition and path calibration.
- Three calibration cycles through 25/100/200/300/375/425/450/500 °C and a held-out sweep. These are calibration setpoints, not sustained service ratings; acceptance includes ≤5 °C residual and ≤1.5 °C residual standard deviation.
- A 100-hour drift/fouling challenge, followed by 500 contiguous hours at nominal 450 °C in an atmospheric furnace; housing upper bound ≤100 °C.
The furnace campaign and pressurized downhole qualification are different envelopes. The latter needs its own pressure, chemistry and packaging evidence.
03 / E1 · Commanded release
Commanded flow release.
This program investigates a commanded mechanical release that restores a flow passage. Its acceptance chain is complete: survive the hold, respond to the command, complete the stroke and recover conductance. Trigger removal alone is not a successful machine.
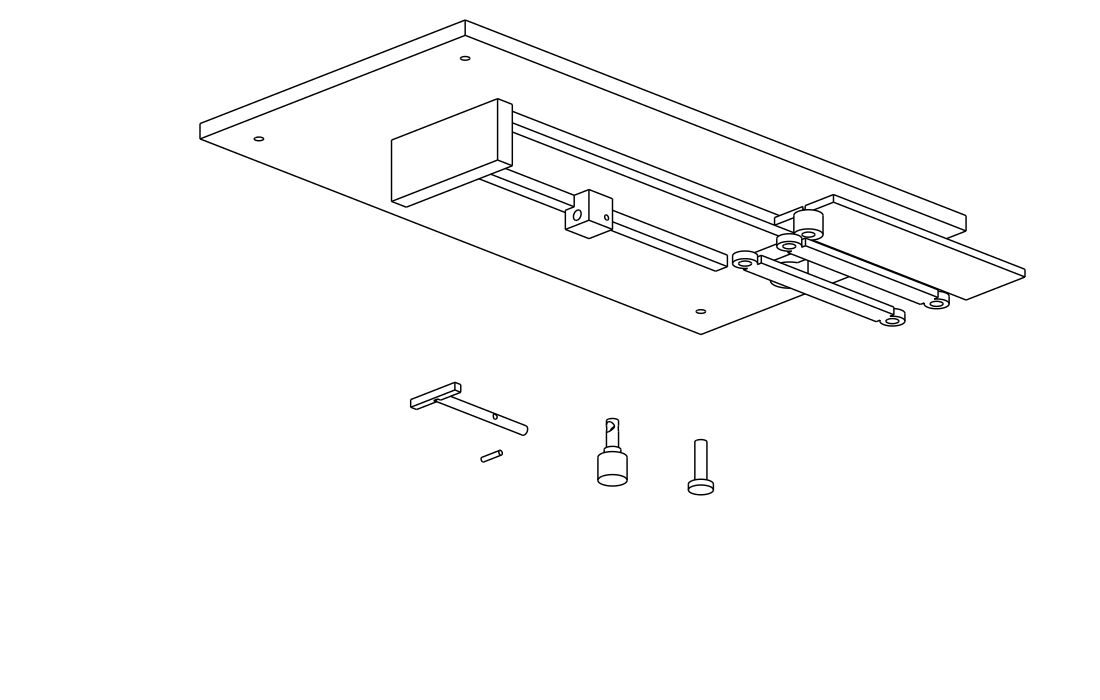
Compare the held and released geometry · Open the dimensioned build sheet .
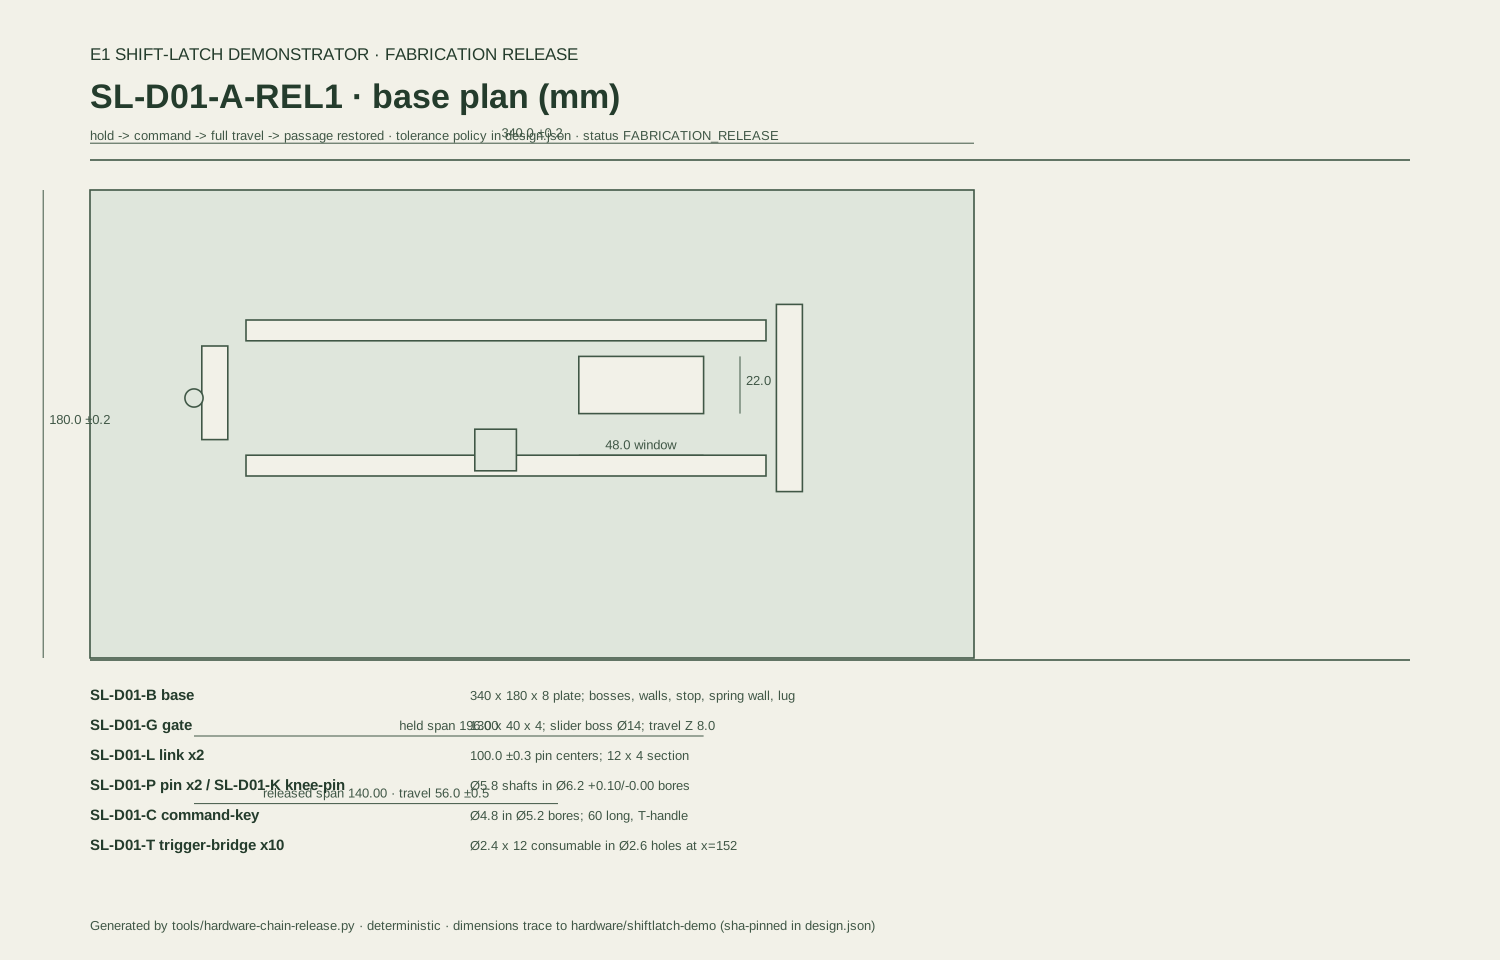
Delivered artifacts. The room-temperature demonstrator has a dimensioned build set, a tolerance stack and a campaign checker. The hot-duty model is registered separately at 200 °C for 76 hours: 72 hours hold plus four hours release/recovery, 10 MPa absolute. That is a development test envelope, not demonstrated service.
Current model result, 5 October. The broad, uncalibrated Monte Carlo envelope passes the complete gate in 6 of 48 simulated campaigns. Recovery kinetics and sustained hold margin are the leading experimental design levers. The older 95.8% result is not the current registered-envelope result.
An independently checked fit to synthetic coefficients passes 48/48 conditional campaigns. It establishes consistency of the fitting and simulation pipeline under those inputs; it is neither physical calibration nor a population-reliability estimate. Experimental coefficient measurements decide which envelope is attainable.
Decisive run. Measure hold survival, command response, full stroke and ≥90% conductance recovery on the same specimen, with an uncommanded control. The production gate judges that sequence, not a collection of unrelated component successes.
04 / E2 · Chemistry & heat transfer
Heat-transfer recovery.
The chemistry program investigates deposit control and recovery of useful heat-transfer performance. Its comparison includes treatment electricity, downstream behavior and the operator's existing cleaning method. A dissolution result is not automatically recovered plant output.
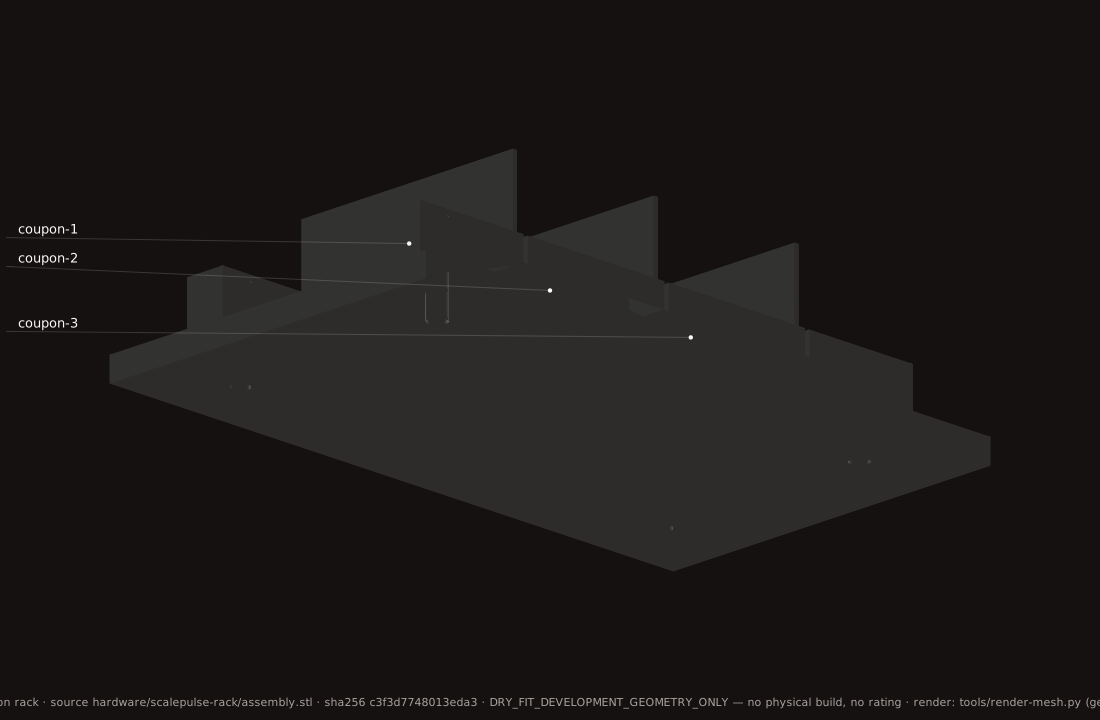
Current state. E2-RECOVERY-2 freezes the three campaign conditions and matched comparison. The component simulation remains INCOMPLETE where matched-condition observations, downstream effects or treatment cost are missing. The earlier statement that three chemistry classes passed does not close these system gates.
The checker rejects non-finite data, negative treatment energy, weakened acceptance thresholds and missing planned conditions. Synthetic positive and deliberately broken records exercise that decision rule; they do not substitute for the physical observations.
Decisive run. Compare recovery and net energy on matched fouled systems, retaining placement, treatment, cleanup and downtime in the cost boundary. The hypothesis earns promotion only when it improves the complete process.
05 / E5 + E7 · Well integrity
Design for the operating history.
Thermal transients impose displacement as well as temperature. E5 develops a moving pressure boundary; E7 tests the casing, connection, cement and seal assembly together. The research question is whether compliance preserves sealing and structural capacity through the specified sequence.
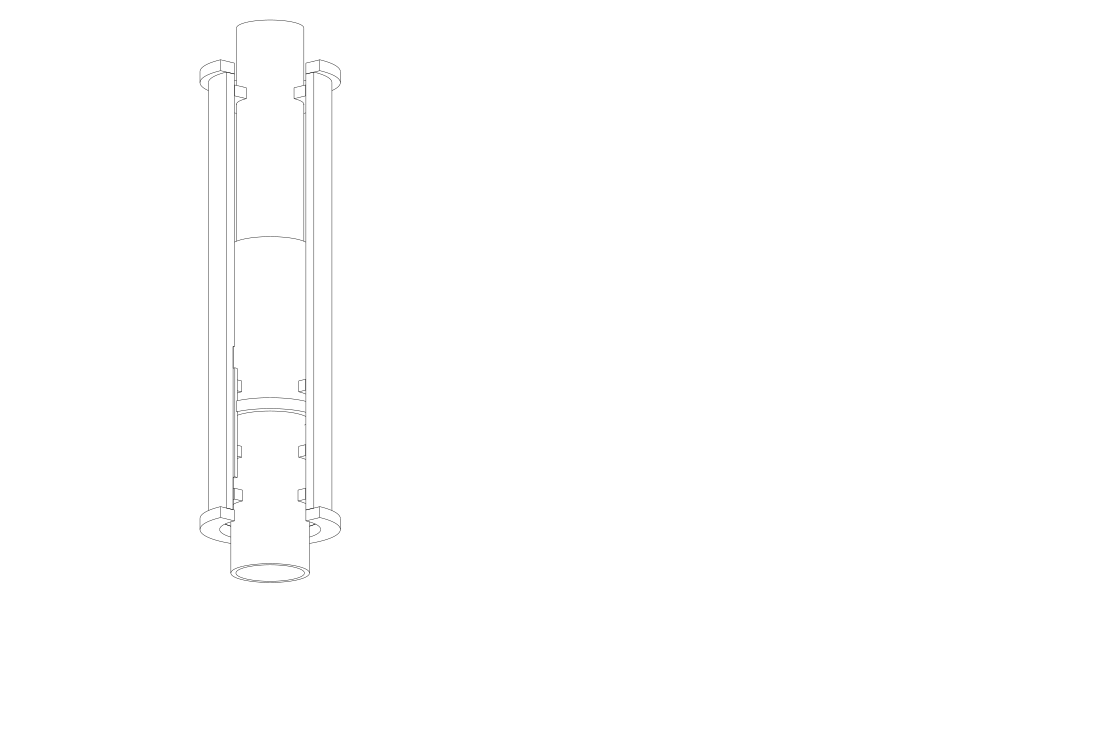
Current bench revision: FS-B01-B. The computational pressure-reaction design and manufacturing artifacts are complete for engineering review. Physical release requires signed facility review, certified material and component properties, measured stiffness and hot-pressure metrology, and supplier gland closure. It is not authorized for pressure operation.
Short-cycle model, not service life. The current cycled-seal campaign covers 1,000 strokes at each of 250/300/320 °C, approximately 18.17 hours per temperature excluding stabilization. Simulated surviving fractions are 93.3%, 94.7% and 88.7%, respectively. These are conditional model outcomes; this campaign does not demonstrate 25-year seal life.
The bench judges leak rate, stroke retention and directional force. Paired mean force cannot replace individual-direction acceptance. Supplier-calibrated seal properties and leak metrology are the next inputs that make this a hardware result.
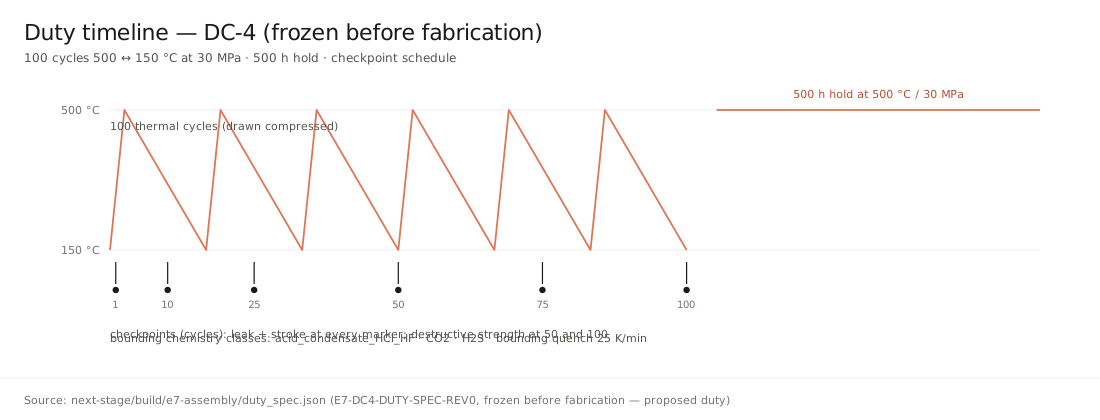
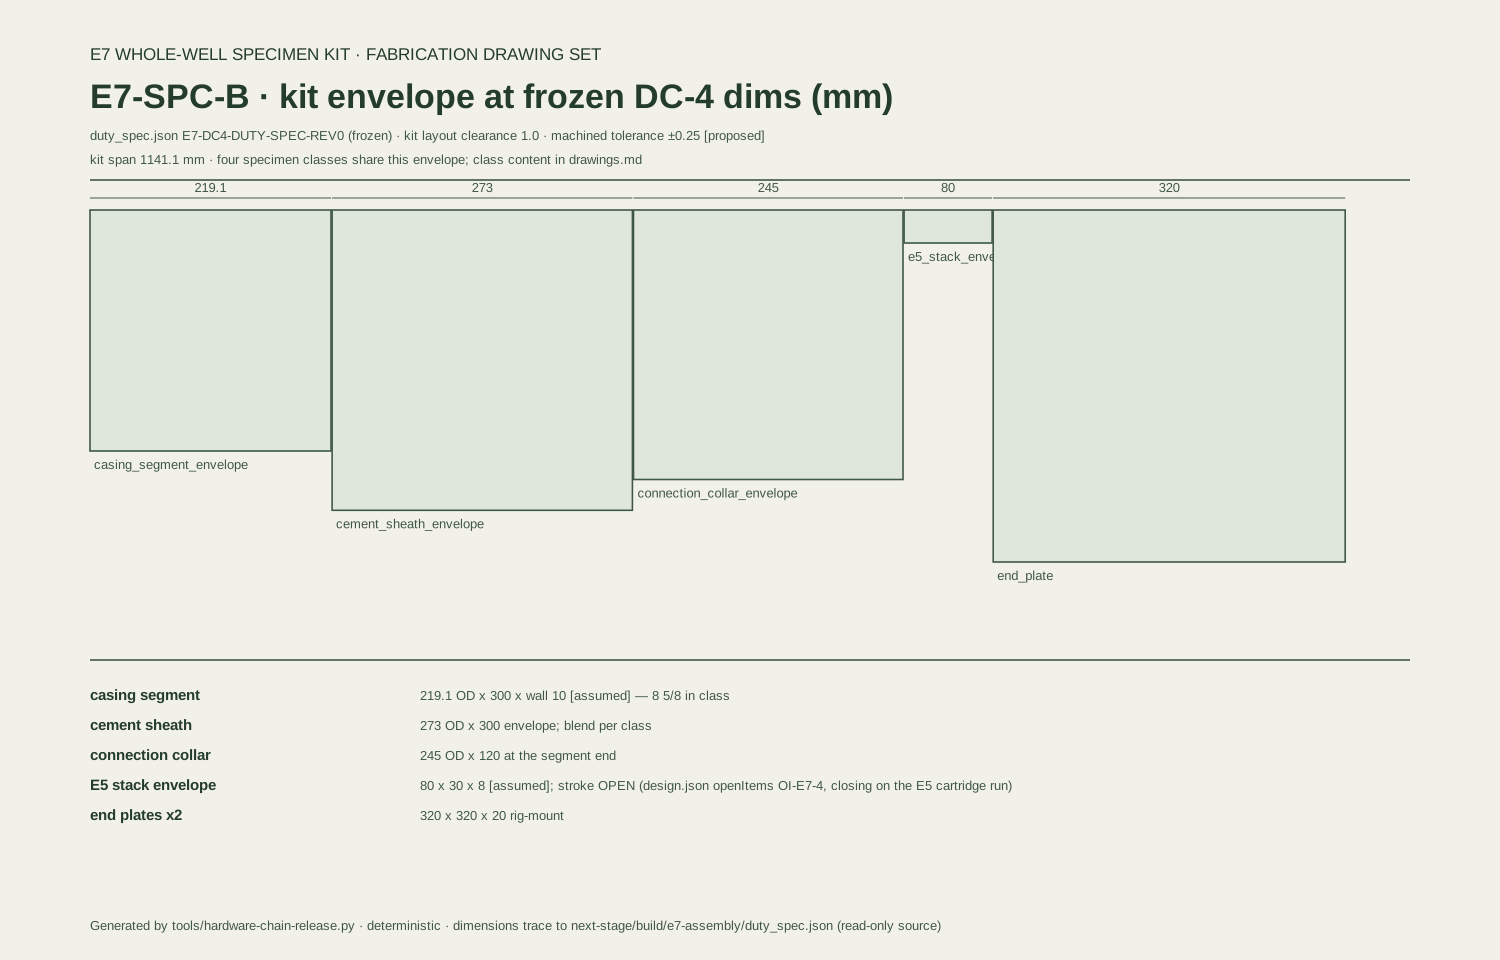
Assembly evidence. The E7-SPC-B specimen kit has a fabrication drawing set. The current checker requires all 12 planned members, ordered cycle/hold coverage, finite measurements and completed life counts. Its 5 October simulated reference passes with a 0.93019 comparison ratio; the deliberately broken comparison (1.2987) is refused. Neither is a measured durability result.
Inspect the concept specimen envelopes · Open the E7-SPC-B build sheet . The retained E7-SPC-A illustrations are envelope geometry, not the later fabrication revision.
IP boundary. The sliding metallic-seal connector field includes US 11,041,343 B2. E5 filing and design-around review remain separate from computational progress; new protected mechanism details are withheld pending the filing/disclosure gate.
06 / Access, flow & conversion
Connect the rock to the power block.
E3 conversion. Power-block research compares conversion architectures at a named resource duty. The earlier hotter-resource study selected flash plus binary bottoming as a development class. The current 200 °C economic example uses its own stored physical trajectory; hotter-resource assumptions are not transferred into that example. A usable vendor comparison must reconcile installed scope, gross versus net output, auxiliaries and the fixed-machine operating map.
E4 drilling-temperature control. The program investigates insulated circulation plus closed-loop control of bottomhole circulating temperature. The insulation is an enabling component; the research contribution is managing the operating band and restart/quench transients. Momentary cooling and sustained drilling duty remain separate.
E6 confined flow. Deliverability, useful thermal contact and long-lived heat recovery require site-specific measurements. The current economic scenario assumes 294 kg/s and a 1 km³ reservoir; neither is an operator-validated resource estimate.
E8 drilling cost. The matched-bit cost case remains INDETERMINATE when no limiter is stable enough across the declared ranges. Matched penetration-rate and bit-life experiments decide the intervention; an unstable ranking is not promoted into a cost-saving claim.
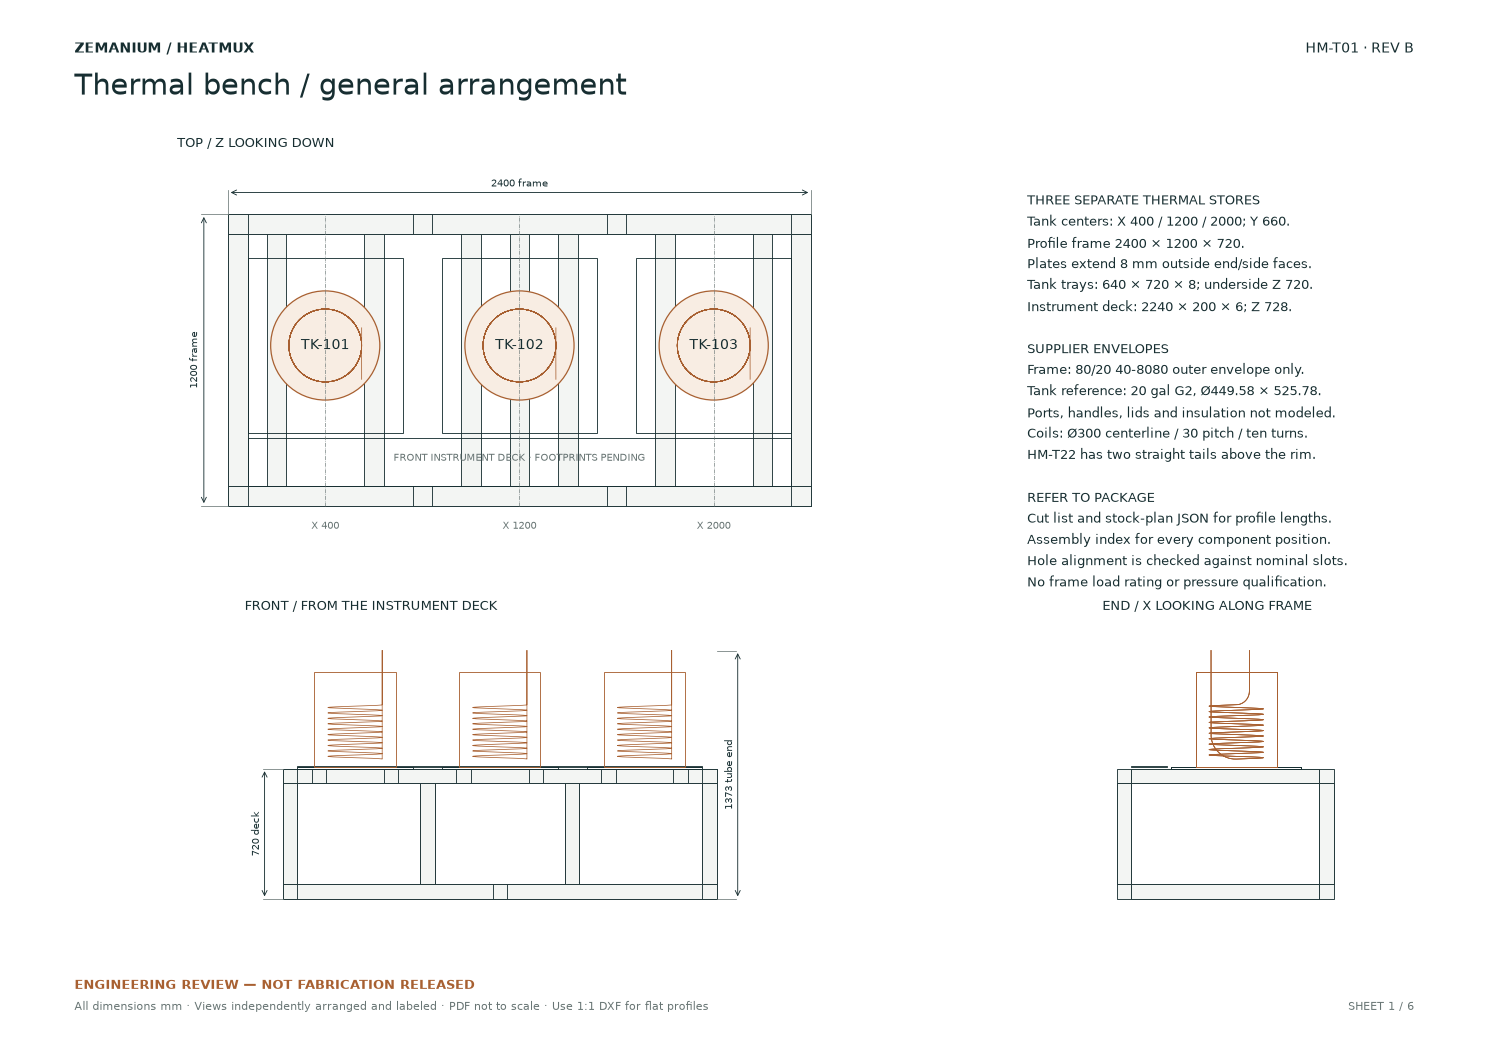
E9 controls and thermal systems. Controls connect sensing, actuation, safe-state behavior and measured output. The public thermal-bench arrangement supplies a concrete engineering surface for source, stores and flow routing. The E9 frozen task set requires all five channels and derives event rates from integer trial counts. Empty records and stale asserted rates do not pass.
07 / Current capital & output model
One physical trajectory.
One shared cost boundary.
The 5 October model prices the same stored resource trajectory under different capital and financing requirements. The plant is sized to 28.322 MW peak gross, not average exported power. Case t200-q294-d12-pi50-v1e+09 assumes 200 °C initial rock, 294 kg/s, 12-inch internal diameter, productivity/injectivity indices of 50 kg/s/bar and 25 simulated years.
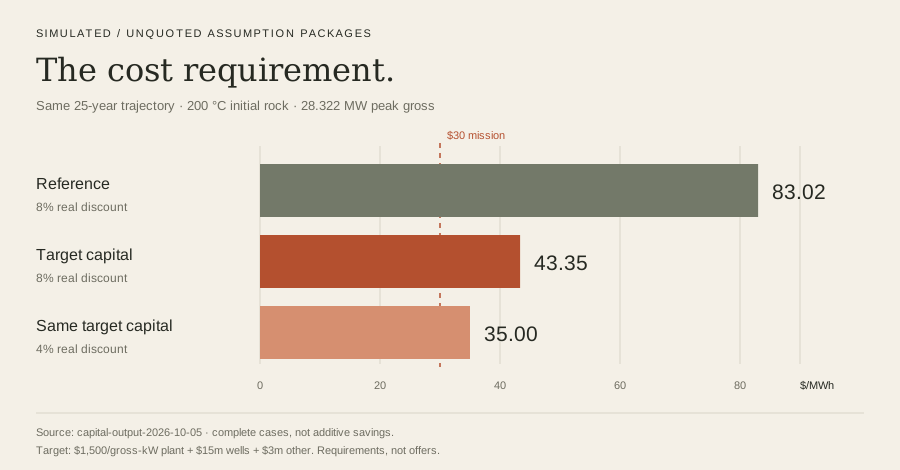
| Assumption package | Plant / gross-kW | Wells + other | Real discount | $/MWh |
|---|---|---|---|---|
| Reference | $3,000 | $37m + $10m | 8% | 83.02 |
| Target capital | $1,500 | $15m + $3m | 8% | 43.35 |
| Same target capital | $1,500 | $15m + $3m | 4% | 35.00 |
Energy ledger. Export equals gross generation minus 5% gross auxiliaries minus pumping. Negative export remains signed; an importing operating year does not receive a low-cost-power claim. Treatment electricity is charged separately wherever treatment is modeled.
Cost ledger. The model uses 2% of capital per year fixed O&M, source make-up water cost, $8/MWh variable cost, a $5m event in year 12 and a $2m event in year 25. Capital is charged at time zero. The other-capital allowance is not a scope-complete estimate; construction interest and pre-operation timing are not modeled. Modeled 90% utilization is not a demonstrated firm-capacity guarantee.
The 1,080-scenario grid and 2,000 shared financial-stress draws expose the requirements and sensitivities. They do not establish geological probabilities, supplier prices or field performance. Scope-matched offers and a calibrated reservoir trajectory are the commercial bridge.
Reservoir-control result. The frozen search stopped after 0 of 12 development cases met the ≥25% headroom gate against both strong oracles. No causal candidate was promoted. The 3.313% median diagnostic against the stronger oracle uses perfect future information and is not deployable controller performance. The next measurement targets useful thermal contact and retention.
Run the current capital/output model
How this supersedes the older economics
The $68.40/MWh example used $107.5m fixed capital. The current reference sizes plant capital from peak gross output and includes explicit other-capital and event allowances. The historical $61.65 → $29.80 ladder and superhot proxy cases are different project definitions, not current controlled-case results. They remain historical design studies, not cumulative savings or delivered prices.
08 / The experimental method
Simulation and bench tests.
Every invention runs a virtual campaign before metal: a stated mechanism, equations, deterministic uncertainty sampling, pre-registered falsifiers and the same decision rules intended for the bench. The simulation directs the measurements; measurements establish physical performance.
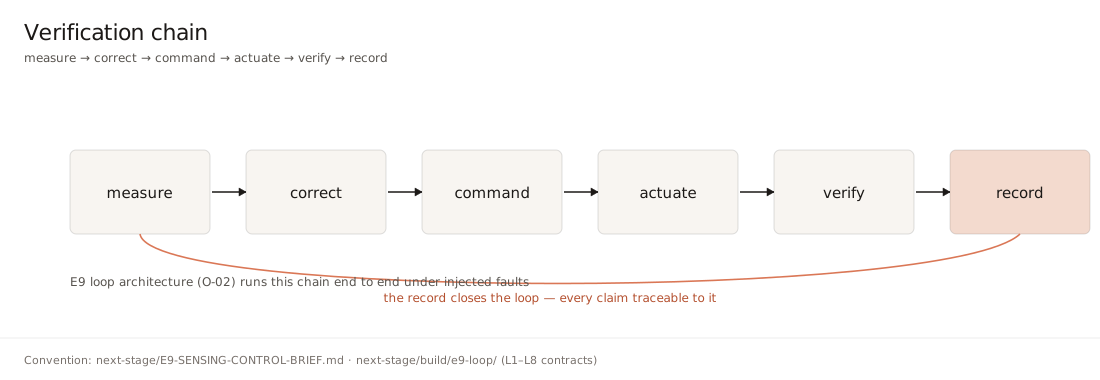
Current gate proof. The 5 October integrated proof exercises seven gate families (E1, E2, E5, E7, E8, E9 and Q) with positive and deliberately broken inputs. All 14 intended verdicts are reproduced. This proves the exercised software decisions, not the hardware hypotheses.
Q record authority. Contracts C1–C11 check source bytes, calibration scope and dates, finite data and independent authority. A hash establishes byte identity, not truth. A typed witness name or a self-assigned “measured” label cannot authorize a physical result. The synthetic positive record remains explicitly unqualified.
Each physical result needs raw data, calibration and environment histories, deviations, specimen identity and an accountable independent verifier. The experiment must cover the claimed temperature, duration, pressure and chemistry; a transient excursion never becomes a sustained rating.
09 / Evidence & next experiments
Records and planned experiments.
| Program | Delivered work | Decisive next evidence |
|---|---|---|
| High-temperature sensing | Digital furnace, blind acquisition, mismatch challenge | Matched-path calibration; held-out waveform and furnace campaign |
| Commanded release | Room demonstrator package; registered hot model; fitting pipeline | Same-specimen hold, command, full travel and recovery |
| Deposit control | Frozen comparison and recovery checker | Matched observations, downstream impact and complete treatment cost |
| Well integrity / assembly | FS-B01-B computational design; E7-SPC-B drawing set | Facility release, calibrated hot-pressure measurements, completed duty sequence |
| Resource / plant | Current trajectory/capital model; public field replay | Authorized operator history, independent outcome and scope-matched vendor offers |
| Controls / Q | Frozen tasks, fault cases, C1–C11 integrity gates | Calibrated physical control run and independently authenticated record |
Public evidence
Hardware drawings and build sheets · Dated supporting study plots · Public historical record downloads · Current interactive models and field replay.
The field replay contains 518 published processed interpretation rows, not a Zemanium operating result. Attribution: SLB / Leonid Kolomytsev; University of Utah / Casey Chadwick; Utah FORGE; GDR 1668; DOI 10.15121/2473673; CC BY 4.0. Depth is measured depth in feet. Missing samples remain gaps; downhole barrel rates are not surface barrel rates.
Engineering record index · 5 October revision
qa/hardware-closure-integrated-2026-10-05.json: integrated checker and package record.qa/hardware-closure-shift-model-2026-10-05.json: current uncalibrated envelope.qa/hardware-closure-shift-analytic-fit-2026-10-05.json: conditional synthetic-fit check.qa/hardware-closure-flex-2026-10-05.json: computational design and physical-release boundary.qa/hardware-closure-proof-2026-10-05.json: seven gate families, positive/broken proof.qa/capital-output-2026-10-05/result.json: shared physical/capital scenarios.
These are repository record identifiers, not public download links. Mechanism-bearing records are shared only through the filing and disclosure process. The public report and drawings above are directly accessible.
Work on the next experiment.
Discuss a research or engineering role